Oil spills are frequently in the news. Make real-world connections in your classroom!
This lesson from NCTM's Illuminations provides hands-on experiences with mixing oil and water, provides surface area information about the 2010 oil spill in the Gulf of Mexico, and gives students opportunities to estimate small oil spills of their own making.
Incorporate timely events. Students who study news and current events in school do better on standardized tests, develop and improve reading, vocabulary, math, and social studies skills, and continue to follow the news as adults. Use magazines, the internet, and the news on television to work current events into your standard curriculum. As the presidential election is fast approaching, look for a lesson plan that will enhance content but also make students more comfortable with the election process. Check out the
Mathematics and Elections page on the Math Forum to get started.
Use authentic data sets or data from students. Instead of making up a set of numbers to teach a new topic such as box and whisker plots or linear regression, find an authentic data set. Another option is to ask your students for information about themselves. For example, ask students to report both the length of their feet and their heights, make a scatter plot, and then sketch in the 'best fit' line. Keeping them involved makes the lesson interactive and more interesting. Students are always interested in finding themselves on a graph.
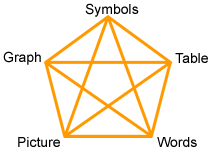
Encourage multiple representations of the same data. Set a good example by using multiple representations. Different representations give us different information. Try to give them a mixture of tables, graphs, words, symbols, and pictures. Some visuals represent the data much better than others. Instruct students to create several, weigh out the advantages and disadvantages of each, and make an argument of which works best in certain circumstances.
Develop good consumers of math. Sometimes advertisements misconstrue data to make it more appealing. Have students examine ads and compare the graphs to the raw data sets. They should be asking questions such as: Are the scales appropriate on the axes? Were some of the data points left? What criterion was used to characterize outliers? Is this appropriate? Did the data come from a survey? What was the sample used? Were the questions biased?
Design activities to predict into the future. The value of mathematical modeling is more than just organizing the data; it is in making predictions about the future that is particularly useful. Examples include 1) looking at population growth in the your city, state, country or the world, 2) looking at world records or Olympic records, and 3) following weather patterns over time. Check out
this applet on NCTM's Illuminations that allows the user to predict the spread of a virus over a population.
Don't be biased when teaching controversial topics. The goal of education is to prepare students to make their own informed decisions. As teachers, we are obligated to give students the tools to become knowledgeable about particular issues, but should always allow them to form their own opinions. It is best if students don't even know their teacher's inclination.
Help students learn to find their own data for research projects. It is a valuable skill to be able to find credible and reliable data, especially on the internet. Direct them to ask themselves questions such as the following: What are the author's credentials? What is the date of the posting? Who is the site's sponsor? Why was the information posted?
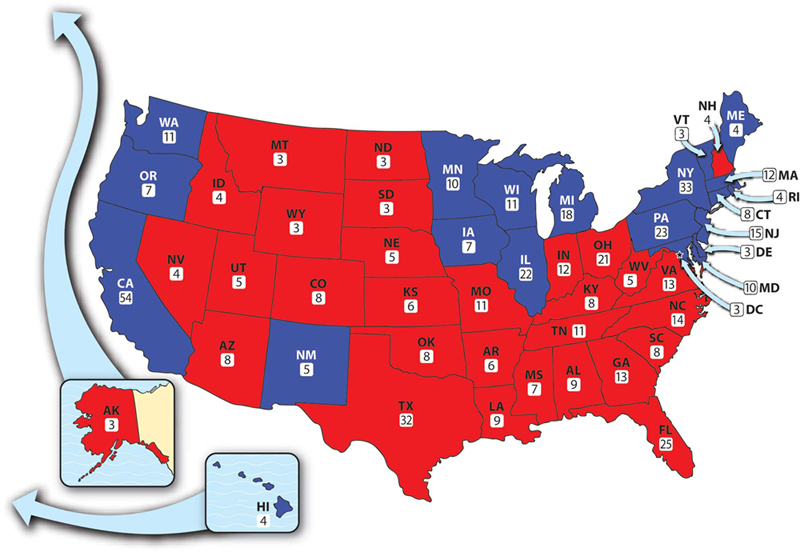
Use maps to enhance understanding. Reading data from a map can be a useful visual tool for learning and applying mathematics. Maps can be used to integrate current events, again including the upcoming election. But, students need to learn to interpret how the data is represented. For example, when studying the 2000 election, if all of the states won by Bush are colored red and all the states won by Gore are colored blue, the relative areas of the states would suggest that Bush was winning by a hefty margin. But when considering population densities and how the electoral votes are distributed, we can see how this map coloring can be misleading. Investigate this more with your class by using the
Getting Into the Electoral College lesson from NCTM's Illuminations.