This activity may require two sessions to complete each of the tasks. First, the students collect data on the class and use that data to generate fractions that describe the class. Because this unit emphasizes data analysis, the students use knowledge of graphing and statistics to complete this lesson.
Before the students can represent class characteristics using fractions, classroom data must be collected. To begin the data collection process, have the students brainstorm a list of the many ways the class or group might be described, for example, by gender, hair color, height, those who own pets, and so forth. This list can be used to create a classroom survey for data collection or you may choose to survey the class with questions from the Class Survey Activity Sheet.
 Class Survey Activity Sheet
Organize the students into five or six groups and have each group select a question from the survey. Give each group an envelope that contains as many scrap pieces of paper as there are students in the class. Have each group record its question and answer choices, if appropriate, on the envelope. For example, if the students ask about gender, they should include two choices, male or female. If it is not possible to identify all the possible choices, the students should leave their question in an open-ended format. For example, a question about types of pets should be left open-ended, as one might not be able to anticipate the variety of pets represented in the class.
Conduct the survey by passing the envelopes around the room and giving each student a chance to respond. Before starting the survey, have the students remove all the paper from their group's envelope and leave it at their table. They will use these slips to record and submit their answer to each survey question. Begin the survey by having group members respond to the question on their envelope first, writing their answer on a slip of paper and placing it in the envelope. When the groups are finished with that question, they should pass their envelope to the next group, and so forth, until all the students have had a chance to respond to all the questions. (If the students in your class would benefit from getting up and moving around the room, instruct the students to leave the envelopes at each table and move from table to table to answer the questions.)
Once data are collected, the groups should tally the responses in their envelope, record the number and represent the quantity as a fraction, for example, 12 out of 24 students (12/24 or 1/2) have blue eyes. Have each group reduce their fractions to lowest terms by finding the greatest common factor. For example, suppose 18/24 (or 3/4) of the class owns a pet. The greatest common factor for 18 and 24 is 6. The students might find it helpful to list all the factors for the numerator and the denominator, 18 and 24 in this example, and locate the greatest common factor. This can be done strategically by checking in order each pair of factors that when multiplied yield a particular product. For example, to exhaust all the factors of 18, one would begin with 1 × 18, then 2 × 9, then 3 × 6. Since 4 is not a factor, the student would move on to 5 and then to 6. Six has already been generated with 3 × 6. When the student begins to duplicate factors, they know they have exhausted the list.
For organizational purposes, it is helpful to write the sets of factors in the following manner. The students should list factors on opposite sides (following the format below) with 1 × 18, then 2 × 9 on the inside of the other factors, then 3 × 6 in the middle. When factors begin to repeat, e.g., 6 × 3, the students know that the list of factors has been exhausted. This list of factors for 18 would be recorded as follows:
| Step 1: | 1 | | | | | 18 |
| Step 2: | 1 | 2 | | | 9 | 18 |
| Step 3: | 1 | 2 | 3 | 6 | 9 | 18 |
Similarly for 24, the list of factors would evolve as follows:
| Step 1: | 1 | | | | | | | 24 |
| Step 2: | 1 | 2 | | | | | 12 | 24 |
| Step 3: | 1 | 2 | 3 | | | 8 | 12 | 24 |
| Step 4: | 1 | 2 | 3 | 4 | 6 | 8 | 12 | 24 |
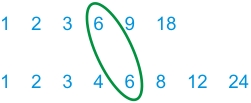
Next, ask the students to list the factors for both numbers one on top of the other so they can easily recognize the common factors. The greatest common factor should be circled. For example:

The students should divide the numerator and denominator by the greatest common factor to reduce the fraction. For example, for 18/24, the students should divide both the numerator and denominator by 6 to reduce the fraction to 3/4.
If it becomes necessary to divide the lesson into two segments, this might be a logical beginning point for the second part of the lesson. Have group members organize their data in a chart and share it with the class. The students should record all fractional representations and may choose to record appropriate statistics on their chart, for example, mean, median, range, and mode for numerical data.
Groups may choose to create their bar graph using the Create a Graph Tool from the National Center for Education Statistics. It might be helpful to show the class how to use the bar graph tool before they begin making their own.
 Create a Graph Tool
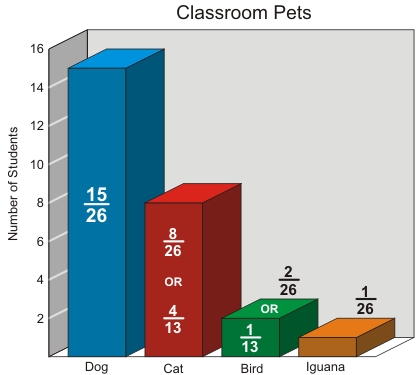
An example of a bar graph of previously collected student data is shown below:

Once the students have created their graph, they should label the data in fractional parts and reduce all fractions to lowest terms. For example, this chart should be labeled with dog being 15/26, cats being 8/26 or 4/13, birds being 2/26 or 1/13, and 1/26 iguana. Ask students to share their graphs with the class and discuss how they used fractions in collecting the data depicted on each graph. If necessary, remind students to consider what the fractions represent, how the data was collected, how categories were established, and how finding the lowest common factor simplified the process of reducing the fraction.