 If it's hot outside how much good does it do to move to the shade? In this investigation students gather, organize and analyze temperature data from sun and shade, and then build their understanding of some standard ways to represent a set of numbers with statistics such as the median, mean and the interquartile range. Read the story behind Sunny & Shady Math here.
Time: Day 1: 60+ minutes for problem formulation and initial data collection
Day 2: 45 -60 minutes with optional extension
For this investigation students will need to be familiar with a temperature scale, either Centigrade or Fahrenheit. They will also need to be comfortable reading a thermometer and recording data using a T-table (see data recording sheet in the materials section). Also, you as the teacher will need to locate an area on the school grounds that has both sun and shade available. A sunny area with bushes that provide shade throughout the day is a possibility.
Day 1 (60+ minutes)
10 minutes: Introduce the investigation and central question
Ask students to recall a time when they were outside and it was very hot. Call on a volunteer or two to describe their experiences. Relate your own such experiences. Ask students:
- When you are outside, what can you do to get relief from the heat?
Listen for the students to describe moving to the shade. Describe your own experiences with shade vs. sun and then ask,
- Why is it cooler in the shade?
- Is it a big difference?
The central question for this investigation is:
- How much cooler is it in the shade?
- (Or, on cold days, “How much warmer is it in the sun?”)
In this investigation you will use mathematics and science to answer the central question. You will take measurements and compare data. Most people will agree that it is cooler in the shade but you will be able to be more precise in your understanding of the difference in temperature between full sun and shade.
15 minutes: Construct a plan for gathering data
Focus on the central question. You want to know how much cooler it is in the shade.
- Is the answer always going to be the same?
- What are some of the factors that might affect the answer?
- How can we use a thermometer, an instrument that quantifies temperature, to answer this question?
Give students 5 minutes to work with an elbow partner or in small groups to come up with a reliable procedure to test the difference in temperature between sun and shade.
.png) After they have had some time to think, take some responses. Because you will likely have more than one group investigating this question in more than one location you will need to have a common set of procedures in place before you begin so that valid comparisons may be made between the results of different groups. For example, you may decide that the thermometers should be placed flat on the ground in places that are known to be fully or at least mostly sunny or shady over the course of the day. This will allow for repeated readings over the course of the day. Thermometers should be read in place. That is, they should not be picked up when they are being read as this may lead to a difference in the reading and/or they might be put back in a different spot
After they have had some time to think, take some responses. Because you will likely have more than one group investigating this question in more than one location you will need to have a common set of procedures in place before you begin so that valid comparisons may be made between the results of different groups. For example, you may decide that the thermometers should be placed flat on the ground in places that are known to be fully or at least mostly sunny or shady over the course of the day. This will allow for repeated readings over the course of the day. Thermometers should be read in place. That is, they should not be picked up when they are being read as this may lead to a difference in the reading and/or they might be put back in a different spot
With regard to recording data, steer them toward ordered pairs (time, temperature), perhaps using a T-table. This will help students to see the connection to ordered pairs that are the basis for points on an x-y plot of temperature vs. time. Provide a data recording sheet if necessary or let them devise their own if possible.
20 minutes: Establish thermometer sites and collect 1st round of data
Form cooperative teams of about three students. Each team will find (or be assigned) a site either in sun or in shade, where they will place their thermometer and leave it for the duration of the investigation. If possible, students should be allowed to decide where they will collect their data but if this seems like it will be challenging you can do this for them. Be sure the thermometers will not be disturbed throughout the day. Regardless of how sites are selected, you need a well-formed and well-understood plan for data collection before you head outside.
Each team will need a thermometer and a simple data sheet. Roles for team members might be thermometer reader, data recorder and timer. Roles may be rotated with each reading. Note: thermometers should be on the ground for at least five minutes before they are read for the first time. Once groups have a solid and well-understood plan for finding their site, establishing and reading their thermometer, recording their data and returning to the classroom, leaving the thermometer in place, you are ready to begin.
x minutes: Gather data throughout the day
Student teams will record data at established intervals throughout the day. Your bell schedule probably will not allow a regular schedule for data collection. Nevertheless, get as many readings as you can through the course of the day. If whole teams cannot go together, individuals may gather data and return to the classroom as your school procedures allow. If possible, across all teams, gather at least a dozen temperature readings in each of the two conditions, sun and shade. After the last readings have been made, have all teams submit their data recording sheets to you. Compile a single list, to be used on Day 2, of all of the temperature readings taken in the sun and another list for those taken in the shade.
----------------------------------------------------------------------------------------------------------------------------------------------------------------------------------------------
 Day 2 (45 minutes to 60 minutes with optional extension)
15 minutes: Examining the data and creating x-y plots
Begin by returning teams' data recording sheets. Each team should create an x-y plot of their temperatures over the course of the day. Compare graphs. The shapes will vary as will the scales employed by different groups but there should be some similarities in the overall shape of the data across the day.
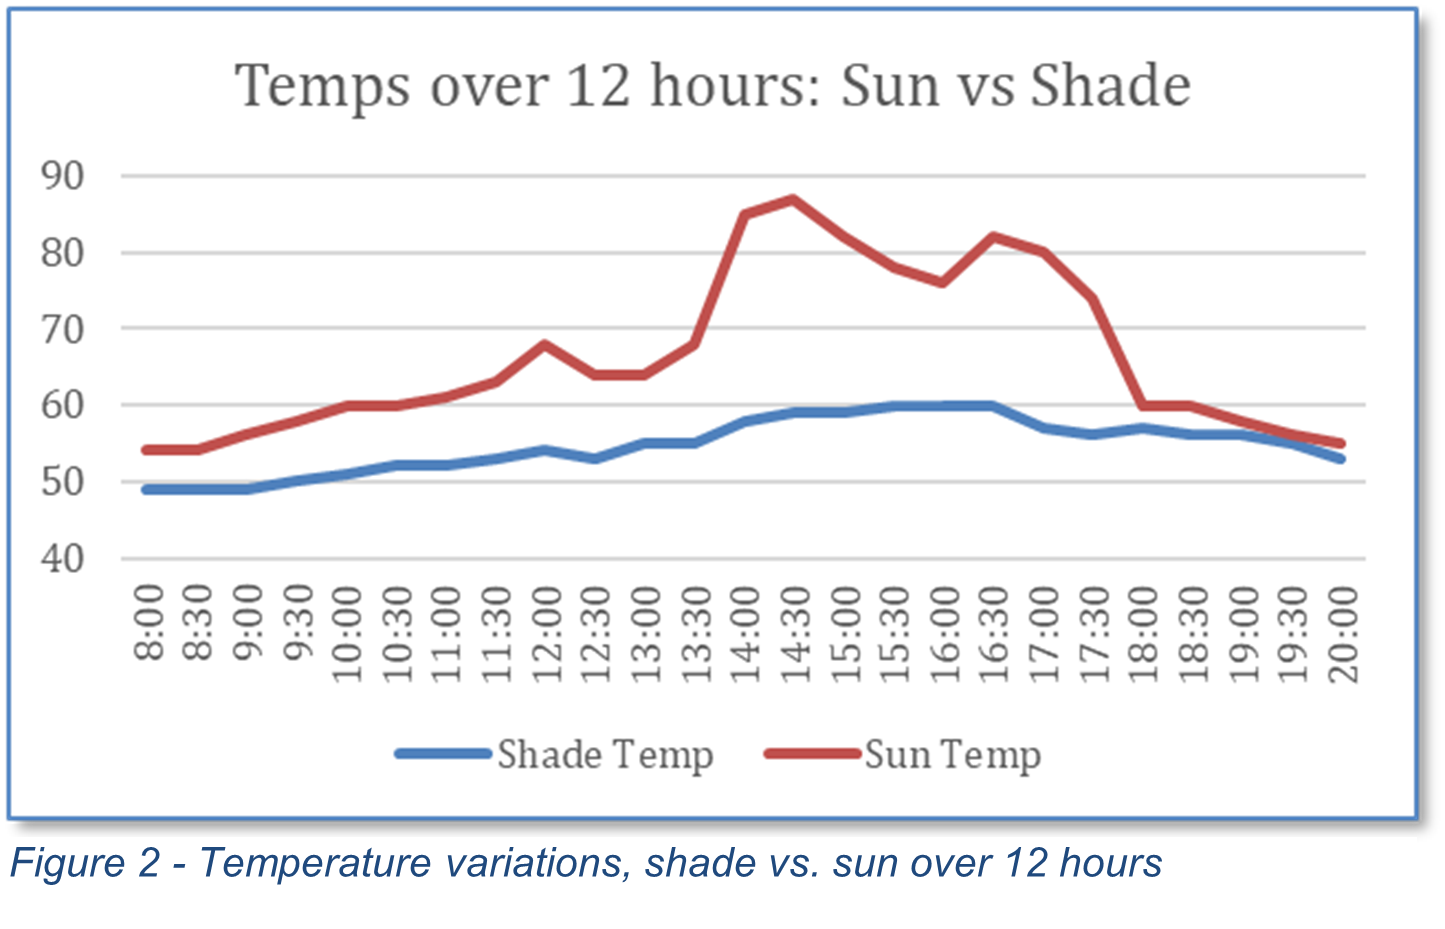
Figure 2 shows two sets of data graphed on a common set of axes. One set came from a shady spot and the other from a sunny spot.
20 minutes: Examining the data for differences in the centers
Setting aside the x-y plots, as a class, show students the lists of sun and shade temperatures you collected at the end of Day 1. Return to the central question:
- How much cooler is it in the shade?
- (Or, on cold days, “How much warmer is it in the sun?”)
There are various ways to represent the center of a set of numbers but the mean, median and mode are most often employed. Concentrating on the median will give you an intuitive check on the differences in the centers of the two data sets and enables consideration of the interquartile range, a measure of variability, if you chose to go there. Steer the class toward using the median, the middle number in an ordered set of numbers, to represent the whole list. Ask students to describe the steps involved in finding the median and ensure that everyone is clear about this process. Give the teams time to compute the medians for both sets of temperatures, sun and shade. Circulate and check for understanding. Then consider the questions:
- How different are the two medians?
- Is that a lot?
- What if we did this again tomorrow, would we get the same readings, the same medians?
- [Optional:] Is one set of data more variable than the other? (interquartile range …)
10 minutes: Consolidate and extend students' understanding of the process
Conduct a whole group discussion of the observed differences. Extend this discussion to other possibilities for investigation.
- What are some different surfaces that might lead to different results?
- Would water show as much variation between temperature and shade?
- What about sand at a beach, does it help to have a beach umbrella?
- What about blacktop in a parking lot? Have you ever run barefoot through a parking lot, looking for shade?
- Do birds build their nests in the shade or out at the end of a branch, in the sun?
- Etc.
With science and mathematics these questions can be asked and answered.
 15 minutes (optional): Extension
In general, shady areas beneath bushes or trees tend to be less grassy than areas in full sunlight. Does the grassiness, affect temperature? Ask students to think of ways to control for grassiness so that it's just the shade rather than the presence of grass that is affecting the temperature.
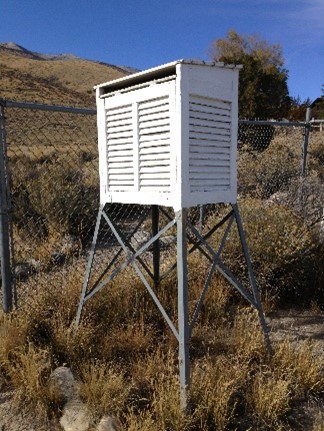
Note: the standard way to measure temperature is to place the thermometer 5 feet above the ground in well-ventilated shade, shielded from rain (See Figure at right.)
Interquartile Range: In the Common Core Standards it is defined this way: “A measure of variation in a set of numerical data, the interquartile range is the distance between the first and third quartiles of the data set. Example: For the data set {1, 3, 6, 7, 10, 12, 14, 15, 22, 120}, the interquartile range is 15 - 6 = 9.”
Median: In the Common Core Standards it is defined this way: “A measure of center in a set of numerical data. The median of a list of values is the value appearing at the center of a sorted version of the list-or the mean of the two central values, if the list contains an even number of values. Example: For the data set {2, 3, 6, 7, 10, 12, 14, 15, 22, 90}, the median is 11.”
Assessments (Be sure to show your work)
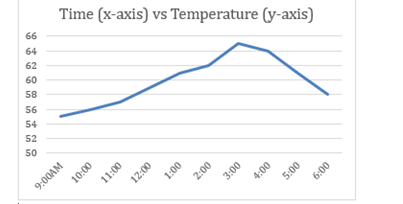
1. Here is a plot of time vs. temperature:

Which of the partial T-tables shown below fits the plot? ___(ans: c)___
.png)
2. Here are 10 temperatures:
60oF, 62oF, 63oF. 65oF, 66oF, 70oF, 71oF, 72oF, 73oF, 80oF
a.) What is the median of these 10 temperatures? __(ans: 68oF) ____
Optional: b.) What is the interquartile range of these 10 temperatures? __(ans: 9oF) ____
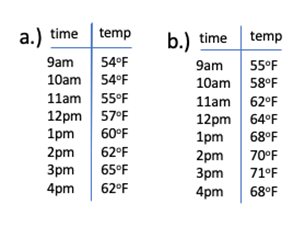
3. Here are two T-tables of time and temperature data. One was taken in a grassy area. The other was taken in a large, nearby field of dirt. Both were in full sunshine.

a.) Find the median temperature for both tables.
Median temperature for a.) ______
Median temperature for b.) ______
b.) Which one was probably taken in the grassy area, a.) or b.)? ______
Briefly explain your reasoning: