Key words: Geometry diagrams; Geometry textbooks; Semiotics; Systemic functional linguistics
Geometry diagrams use the visual features of specific drawn objects to convey meaning about generic mathematical entities. In this way, geometry diagrams are essentially dual: On the one hand, they are objects that can be described by their spatiographical properties (e.g., a straight stroke oriented NW–SE; Laborde, 2005); on the other hand, they are signs that represent general concepts that have theoretical properties (e.g., a line separating two points; Fischbein, 1993). That the spatiographical properties of a particular diagram can suggest theoretical properties of a geometric figure that might not be provable in general has, in part, given rise to what Inglis and Mejía-Ramos (2009) called the “common view” (p. 100) of the role of visual representations in mathematical arguments. They wrote: “Pictures may be useful heuristic tools which suggest ways of understanding proofs, but . . . are nevertheless inappropriate when it comes to . . . providing a proof” (Inglis & Mejía-Ramos, 2009, p. 100).1
Davis (2006) relayed an anecdote (attributed to numerous mathematicians) about the algebraic geometer Oscar Zariski that encapsulates this view:
Oscar Zariski (1899–1986) liked pictures. But pictures can be misleading. . . . In presenting proofs in class he used to draw little pictures in the corner of the blackboard to help him recapture the heart of the matter, and then erase them rapidly as though they were polluting and he were ashamed of having drawn them. (p. 147)
The common view holds that 19th century mathematicians retreated from arguments that relied on diagrams in favor of arguments that were completely contained in propositions that could be stated solely with linguistic and logical symbols (Barwise & Etchemendy, 1996; Davis, 2006; Greaves, 2002; Inglis & Mejía-Ramos, 2009; Miller, 2007). Thus, in his attempt to improve Euclid’s geometry, Hilbert (1999) included axioms of separation and order that Euclid had completely omitted. Such decisions permitted Hilbert to develop a geometry that, unlike Euclid’s, did not rely on information conveyed by the diagram (see Grattan-Guinness, 1998, pp. 566–568).
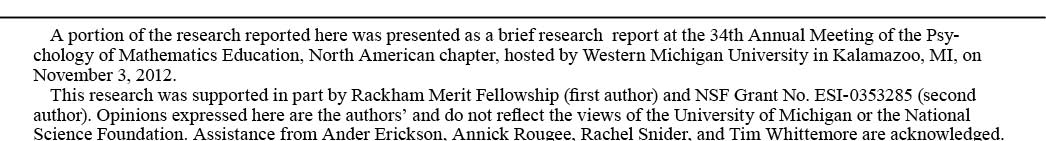
At roughly the same time mathematicians were developing diagram-free axioms for geometry, those concerned with teaching school mathematics were devising new strategies for structuring how students interact with geometry diagrams. Baker (1902) proposed a notation for what he called automatic diagrams, the use of which would allow the student to read “the proposition, the demonstration, and the conclusion” (of a proposition and its proof) directly from the diagram (p. 486). This automatic system was a standardized set of visual features that included using letters from different alphabets (e.g., Greek, Roman) to label different parts of the figure (e.g., angles, lines, respectively), different stroke weights to differentiate what is given from what is to be proved, and a set of specially defined symbols to visually mark the relationships that hold among different parts in the display—for example, using a dotted sigmoid line to indicate that two lines are parallel or using a small quadrant to indicate a right angle (Baker, 1902). Figure 1 shows an example of these different features used in a diagram.
According to Baker’s (1902) scheme, we see in Figure 1 that l, m, and n are the given lines because of their labels (middle letters of the alphabet) and thickness (heavier stroke). These markings establish theoretical properties: The small quadrant between l and n indicates perpendicular lines, and the dotted sigmoid linking l and m indicates lines that are parallel. What remains to be proved is that m is also perpendicular to n. To this end, a1 (early letter in the alphabet, lighter stroke) has been drawn in for demonstration. A is the angle between a1 and n, and because it is marked by a dotted quadrant, it is a right angle, meaning that a1 is perpendicular to n. Thus, a1 and m are two straight lines that are perpendicular to the same line and are therefore parallel to each other. This means that a1 and m must coincide because the parallel through a point to a line is unique, which means that angles X and A coincide, and so it is established that n is perpendicular to m. According to Baker, this demonstration follows from the visual grammar of the diagram.
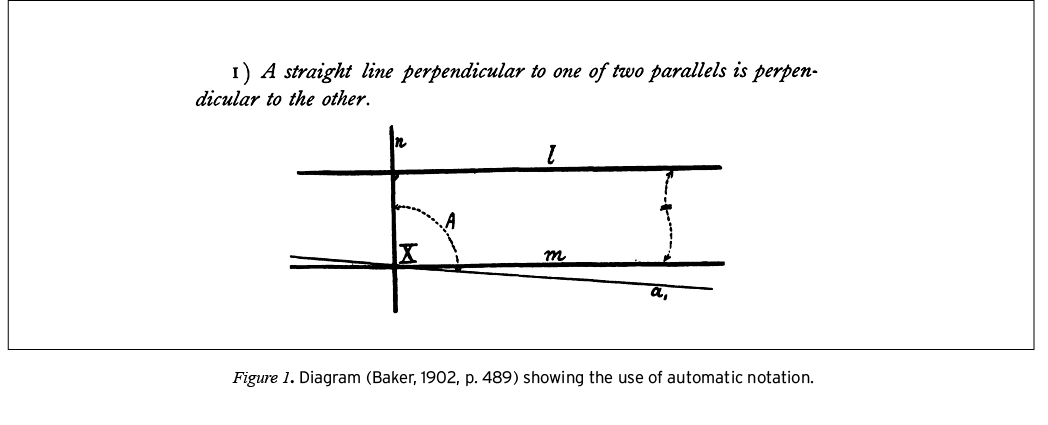
Baker’s (1902) proposed scheme for using the visual features of diagrams as the means through which geometric properties could be conveyed marked the beginning of an evolution of diagrams in geometry textbooks. The legacy of Baker’s program is evident in 20th century geometry textbooks, where colors, styles (e.g., dashed versus solid lines), weights (e.g., heavier or lighter strokes), labels, and specialized symbols are applied to the parts of a display, using the visual appearance of diagrams to communicate geometric properties. Figure 2 shows a reproduction of a diagram that captures the state of the art of some of these features.
Figure 2 displays different stroke weights (the circumference of circle C is lighter than any of the other strokes in the diagram), different colors (in the original, the lighter strokes are blue and the darker strokes are red), and symbols (small squares to indicate that the tangents are perpendicular to the radii at points R and Q; arrows at the ends of  to establish that they are rays emanating from point P ) to visually convey relationships that are represented by the diagram. The differences in stroke weight serve to emphasize the segments and rays, and differences in color are used to group related parts in the figure: The tangents and the circle they are tangent to are colored gray (blue), and the auxiliary segments that define triangles one could use to establish the congruence are black (red). The diagram in Figure 2 is a static, complete whole, and yet the use of weight, color, and symbol alert the viewer to clauses one could use this diagram to make. One such clause is the statement that triangles PQC and PRC are congruent. The small boxes indicating perpendicularity convey that PQC and PRC are right triangles, and the segments grouped by color call attention to what one would use to make a hypotenuse-leg congruence argument. Such an argument2 could be discerned directly from the diagram, but to do so, one must recognize that its apparent visual differences are deliberate, systematic, and meaningful. In short, one must have the literacy skills to read an argument from what is visually presented in the diagram.
Although experienced teachers know how to effectively and clearly present visual information to students (Gal & Linchevski, 2010), the literacy skills necessary to read diagrams are generally not explicitly taught to students (Kress & van Leeuwen, 2006). Thus, materials provided for students involve intricate, technical visual representations that students are assumed to know (or to be able to figure out) how to decode; however, at the same time, materials expected from students privilege writing as the expected and dominant mode through which students are required to communicate their ideas (Kress & van Leeuwen, 2006). To teach students to interact with multisemiotic texts, such as the diagram shown in Figure 2, scholars have called for explicit visual literacies, especially in technical fields like mathematics (Kress & van Leeuwen, 2006).
In the case of geometry, the need for visual literacy is pronounced because students can be caught between two extremes for the permissibility of visual images in mathematics. “We must have [visual] images; we cannot have [visual] images” (Gallison, 2002, p. 323, as cited in O’Halloran, 2005, pp. 129–130). In their roles as representatives of the discipline of mathematics (Yackel & Cobb, 1996), geometry teachers warn students that diagrams can be misleading and that proofs cannot depend on the features of a diagram—We cannot have visual images. However, in their roles as facilitators of student learning, teachers recognize that diagrams are indispensable aids for solving problems (Lampert, 1993) and that diagrams help ground the study of abstract geometric objects in particular realizations that are accessible to students—We must have visual images.
Geometry teachers rely on diagrams to communicate properties of order, incidence, and separation (Herbst, Kosko, & Dimmel, 2013) because a completely general treatment of such properties would make the already challenging work of learning to write proofs even more difficult for students. For example, in a proof about the angle bisectors of a parallelogram, teachers expect the diagram accompanying the proof to communicate that a point of intersection for the bisectors exists and that it exists wherever (relative to the interior or exterior of the figure) it appears to exist based on the figure that is drawn. Exhaustive consideration of the different possible cases would require applying axioms of betweenness, completeness, or separation as well as (potentially) drawing different diagrams to treat different cases or, at the least, stipulating a without-loss-of-generality argument that establishes the independence of the result from the position (relative to the interior or exterior of the figure) of the points of intersection of the angle bisectors. Mathematically, these are subtle, nontrivial issues that gave rise to the common view of visual representations in mathematical arguments (Inglis & Mejía-Ramos, 2009). Yet students are expected to discern these properties from some diagrams but not others—for example, whether two segments are congruent or two lines are parallel is not something one can deduce from the mere spatiographical appearance of a figure (see Hsu & Silver, 2014).
Even seemingly straightforward actions such as identifying the shared segments of adjacent plane figures or naming an angle using the endpoint-vertex-endpoint convention can be challenging for students (Gal & Linchevski, 2010). Many students struggle to develop their visual intuition in mathematics (Arcavi, 2003; Eisenberg, 1991) or learn to dogmatically reject arguments that involve visualizations in any meaningful way (Inglis & Mejía-Ramos, 2009). Gal and Linchevski (2010) argued that theories of visual perception could spur the development of didactic strategies that could help students cope with the challenges of visual processing in mathematics. A model of visual processing is only part of what is needed. Teachers must also be aware of how arrangements of visual resources (e.g., dots, strokes, symbols) cohere as diagrammatic texts. Accordingly, we argue that a theory of diagrammatic literacy is of equal importance to helping teachers develop strategies for teaching students how to read mathematical images.
The research reported here contributes to developing strategies for teaching diagrammatic literacy on two fronts. First, drawing on the theory of social semiotics (Halliday & Matthiessen, 2004; Lemke, 2003; O’Halloran, 2005; O’Toole, 2011), we conducted a semiotic inquiry (van Leeuwen, 2005) of diagrams in geometry textbooks. The result of this inquiry was a conceptual framework for describing geometry diagrams as mathematical texts that communicate meaning through different semiotic systems. Two research questions drove this part of the study:
1. What visual resources do geometry diagrams use to convey geometric properties?
2. What is the semiotic structure of these resources?
By analogy, the semiotic systems of geometry diagrams identified below are a first attempt at creating a classification of the different resources that are available when making diagrammatic texts. By explicitly identifying these resources, we have described the scope of what could be considered when teaching diagrammatic literacy.
Second, we used the semiotic framework we developed to conduct a corpus study of 2,300 diagrams that appeared in 22 geometry textbooks from mainstream publishers. The dates of publication of these textbooks span the 20th century, ranging from 1913 to 2001.3 The primary goal of the corpus study was to examine the viability of the semiotic framework as a means for analyzing geometry diagrams. In the process of conducting this corpus study, we compiled an archaeological record (Donoghue, 2003) of textbook diagrams that gives a glimpse of how the literacy demands for reading geometry diagrams have changed during the 20th century. In the first section of the article, we report on the iterative development of the semiotic framework, and in the second section of the article, we report on the corpus study of diagrams in geometry textbooks. We conclude with a discussion that situates this work with respect to the more general concern of teaching and researching visual literacies in geometry.
Theoretical Framework
Functional Grammar and Semiotic Systems
Our study of geometry diagrams drew on the social semiotic theory known as systemic functional linguistics (Halliday & Matthiessen, 2004) and its extensions to multimodal texts (Kress & van Leeuwen, 2006; O’Toole, 2011) and social situations (van Leeuwen, 2005). Systemic functional linguistics is a theory of language that links linguistic expression with meanings construed in contexts of use. A key theoretical point of a social semiotic inquiry is that a context of use is defined broadly as any situation where meaning potentials can be realized through the exchange of semiotic resources (O’Halloran, 2005; van Leeuwen, 2005). In mathematics education research, systemic functional linguistics and social semiotics have been used to examine classroom discourse and conversations among teachers (e.g., González & DeJarnette, 2012; Herbel-Eisenmann & Otten, 2011; Herbst & Kosko, in press; Kosko & Herbst, 2012; Lemke, 1990; Mesa & Chang, 2010; Schleppegrell, 2007, 2010; Shreyar, Zolkower, & Pérez, 2010; Zolkower & de Freitas, 2012; Zolkower & Shreyar, 2007). Some scholars (e.g., Lemke, 2003; Morgan, 2011; O’Halloran, 2005; Pimm, 1987; Tang, 2011) have also used systemic functional linguistics to investigate the mathematics curriculum. Our present work builds, in particular, on O’Halloran’s (2005) account of the linguistic, symbolic, and visual semiotic systems of mathematics.
The systemic functional perspective originated with Halliday’s conception of grammar, whereby he posited that grammar consists of a set of systems (e.g., transitivity, mood, conjunction) that offer choices for writers and speakers to realize meanings (Halliday & Matthiessen, 2004). These systems allow language to fulfill three metafunctions that are simultaneously present in any instance of communication. Halliday (1973) used metafunction to distinguish these overarching meaning potentials from more specific, immediate purposes or functions that language might fulfill, such as the function of giving directions. The ideational metafunction constructs experiential and logical meanings (Halliday & Matthiessen, 2004; O’Halloran, 2005). The interpersonal metafunction construes the relationship between author and reader or between speaker and audience. Finally, the textual metafunction organizes language to create coherent messages (Halliday & Matthiessen, 2004; O’Halloran, 2005).
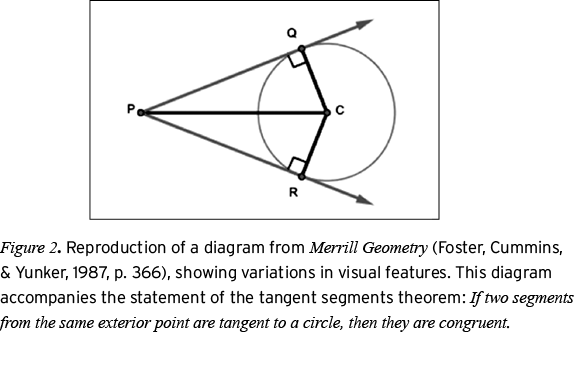
The ideational, interpersonal, and textual metafunctions are realized in language through choices in different semiotic systems (Halliday & Matthiessen, 2004). A semiotic system can be represented as a network of choices that show the range of values available for a particular semiotic resource (Eggins, 2004). Within such networks, choices span the range of possible values for a semiotic resource in the system. The choices represented in the networks are not choices in the sense of deliberate, conscious choices but rather choices in the sense of a mapping of a space of possibilities, as in when one describes the outcome space of a random trial in probability. The framework we describe below uses networks to represent the choices within different semiotic systems of geometry diagrams. Because semiotic systems are the keystone of the linguistics analogy we draw upon to analyze geometry diagrams, we foreground this analogy by using systems to catalog some of the semiotic resources that regulate a well-known social semiotic system, that of traffic flow on roads.
Two general classes of semiotic resources that help coordinate the movements of vehicle operators (or pedestrians) are traffic signals and traffic lanes.4 Traffic signals communicate (to vehicle operators or pedestrians) when it is appropriate to initiate specific movements (e.g., proceed, stop), whereas traffic lanes constrain what movements (e.g., move forward, turn left) are available from a given position on the road. Wherever roads meet at an intersection, some combination of signals and lanes will be used to regulate the flow of traffic. The range of signal and lane combinations possible at any intersection can be represented by network diagrams for each of these systems, as shown in Figures 3 (signals) and 4 (lanes). Figures 3 and 4 show different levels (left to right) within the semiotic systems for traffic signals and traffic lanes. At the leftmost level, there is a choice between signal and no signal (which appear in Figure 4 as designated or non-designated): Either an intersection is marked by a traffic signal, or it is not. One of these two conditions must hold, and depending on which condition holds there may be additional choices. Because the choice between signal and no signal is an exclusive-or, it is represented in the network by a square bracket; inclusive-or choices are represented by curly brackets. For each of an intersection’s traffic signals, there are choices for whether the signal is a traffic sign (e.g., stop, yield) or a traffic light. Semiotically, these additional choices are levels of delicacy at which the resources in the system can be realized (Halliday & Matthiessen, 2004). There are levels of delicacy for the systems of traffic signals and traffic lanes that are not shown in the networks in Figures 3 and 4, such as choices for the shape of a light (e.g., arrow-shaped, circular, or some other shape) or choices for the direction of merging (e.g., merging left, merging right, merging from both directions), but the networks as shown provide a starting point for making catalogs of the semiotic resources for regulating traffic.
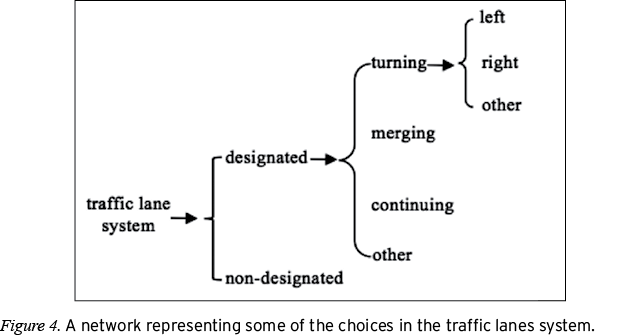
These networks also illustrate a key feature of systemic analysis: Although the functions of communicating when a driver can move and what directions of movement are available from a given position in the intersection can be separately analyzed using the semiotic systems mapped above, it is also the case that roads rely on both of these systems in order to regulate traffic most effectively. Furthermore, particular choices within the lane and signal systems can simultaneously fulfill different traffic regulation functions—for example, a green arrow communicates both turn now and turn left, and an onramp communicates both merge right and merge now. That a single text (in this case, a traffic intersection) may be analyzed using multiple semiotic systems and that these systems may fulfill different communication functions are key theoretical precepts we used to build a framework for analyzing geometry diagrams.
Semiotics and Geometry
The semiotic perspective sketched above has been used to look specifically at the forms of communication within mathematics. Scholars have argued that mathematical communication employs various semiotic systems to make meanings, in particular language, symbols, and visuals (Lemke, 2003; O’Halloran, 2005). O’Halloran (2005) defined diagrams as one such system, using diagram in the broadest sense to include “Venn diagrams, geometrical figures and other figures such as those found in graph theory and topology” (p. 133). She presented a systemic functional framework for analyzing all visual communication in mathematics to provide a grammar of mathematical visual images. Our contribution draws from O’Halloran but drills deeper into the specifics of one kind of visual image. The semiotic framework described below applies specifically to geometry diagrams, which we operationally define as the two-dimensional visual representations that accompany problems (e.g., proof problems, find problems, determine problems) in plane geometry.
Geometry diagrams are a distinct mode of mathematical communication. Building on the work of Duval (2006) and Pimm (1987), Weiss and Herbst (2007) argued that geometry diagrams are part of what they call the diagrammatic register (see also Herbst et al., 2013). They noted that through the use of various graphical resources (including representations of geometric objects and markup symbols), the diagrammatic register anchors abstract concepts and their relationships to realizations of those concepts in particular pictorial objects Thus, one may use specific parts of a diagram to make general claims about the geometric concepts those parts represent (see also Herbst, 2004).
That geometry diagrams are multisemiotic and that the multiple semiotic functions geometry diagrams can fulfill affect how students use geometry diagrams to solve problems has been a recurrent theme of research on geometry diagrams (Duval, 1995; Fischbein, 1993; Herbst, 2004; Laborde, 2005). Laborde (2005) drew a distinction between spatiographical versus theoretical properties of a diagram. A geometric figure can be defined as a set of points that satisfy some given properties (e.g., an isosceles triangle ABC with sides  congruent), and a geometry diagram can be used as a visual representation of such a figure. As a representation, the diagram displays the properties that define the figure (e.g., the strokes for
  are the same length), the theoretical properties of the diagram. However, the diagram also has other properties that are not necessitated by the definition of the figure but rather depend on the features of a particular diagram—for example, the stroke for side
  is either longer, shorter, or just as long as the other two, but only one of these possibilities is the case in the diagram drawn. That is an example of a spatiographical property (Laborde, 2005). According to Laborde (2005), diagrams support the reading of spatiographical and theoretical properties, and these readings may even contradict each other. Diagrams are thus ambiguous representations of sets of geometric objects and their relations (see also Parzysz, 1988).
Laborde’s (2005) distinction between spatiographical and theoretical properties of a diagram is related to Fischbein’s (1993) theory of figural concepts as well as to Herbst’s (2004) distinction between different modes of interacting with diagrams. Fischbein argued that the objects of geometry—points, lines, planes—are juxtapositions of abstract concepts (i.e., “the mental entities with which the mathematician deals,” p. 141) and materialized models of those concepts. There is a material thing that a mathematician uses as a reference when contemplating the objects in geometry, but those geometric objects ultimately “do not exist . . . in reality” (Fischbein, 1993, p. 141). According to Fischbein, a figural concept is the terminus of a cognitive limiting process that fuses these two modalities—the logical structure of the concept and the spatial properties of its materialized models—of geometric objects. Fischbein remarked that achieving this fusion often proves difficult for students and noted several cases in which students could state theorems about abstract concepts yet did not fully grasp the generality of what they knew to be true.
Herbst (2004) argued that the different semiotic resources within the diagrammatic register allow for different modes of interacting with diagrams—different ways that a student (or other actor) may operate on the objects in a diagram in order to make claims about the geometric objects the diagram represents. For example, in the empirical mode of interaction, a student acts on a diagram by looking at it, measuring its different parts, or drawing on it, “only constrained by the actual features of the physical drawing and the operational constraints of the physical instruments of interaction” (Herbst, 2004, p. 130). In the generative mode of interacting with diagrams, the student acts on the diagram by constructing new objects, labeling points, and otherwise using it as a physical model that might suggest possibilities of theoretical properties that could be true about the figure it represents (see Herbst, 2004 for an elaboration of other modes of interacting with diagrams).
An undercurrent of Fischbein’s (1993), Herbst’s (2004), and Laborde’s (2005) inquiries into how geometric objects relate to geometry diagrams is that geometry diagrams can realize multiple meaning potentials simultaneously. By virtue of this simultaneity, modeling the semiotic structure of geometry diagrams using the systemic functional approach provides theoretical resources through which these different meaning potentials can be systematized and analyzed. The work described below to characterize geometry diagrams from a semiotic perspective conceptualizes visual images as coherent semiotic systems in which differences in visual features are purposeful and exist to convey particular meanings to viewers (Kress & van Leeuwen, 2006; O’Toole, 2011). Our approach complements the interest that other mathematics education researchers and cognitive scientists have taken in the role that diagrams play in geometric thinking and learning (e.g., Butcher, 2006; Christou, Mousoulides, Pittalis, & Pitta-Pantazi, 2004; Clements & Battista, 1992, 2001; Gal & Linchevski, 2010; Koedinger & Anderson, 1990; Larkin & Simon, 1987; Moore-Russo, Viglietti, Chiu, & Bateman, 2013; Zimmermann & Cunningham, 1991). In particular, our approach complements work by Alshwaikh (2010, 2011) that examined geometry diagrams using social semiotics.
Alshwaikh (2010, 2011) drew on work by O’Halloran (2005) to describe the ideational (which he broke down into narrative and conceptual), interpersonal, and textual metafunctions of diagrams. He provided detailed qualitative analyses of numerous examples to illustrate how diagrams realize these metafunctions. Alshwaikh’s (2010, 2011) analysis of diagrams is linked to our research through the systemic functional perspective; however, our work pursues a different analytic strategy. We organize our analysis of geometry diagrams by systems of semiotic choice and use these systems to conduct an inventory of the choices that are realized in diagrams in different textbooks.
A Semiotic Catalog for Geometry Diagrams
We developed a semiotic catalog for geometry diagrams via the method of a semiotic inquiry (van Leeuwen, 1999, 2005). Van Leeuwen (2005) described the work of conducting such an investigation as collecting, documenting, and systemically classifying the resources that are available for making meanings in particular texts (p. 3). In the case of the present inquiry, the texts in question were geometry diagrams, and the organization of the catalog was tailored to answer three questions:
• What are the possible ways in which geometry diagrams may visually differ from one another?
• What visual resources do geometry diagrams use to convey geometric properties?
• What is the semiotic structure of these resources?
We developed the semiotic catalog by examining diagrams in 20th-century geometry textbooks that were published by mainstream publishers, including textbooks from the Macmillan, McGraw-Hill, Merrill, Glencoe, and Ginn and Company publishing houses. The method of developing the catalog was iterative (Alshwaikh, 2011; van Leeuwen, 1999, 2005) in that after a classification scheme was initially proposed, the corpus of textbooks was searched to find diagrams that had features that were not accounted for in the scheme. After such features were discovered, the semiotic catalog was revised to account for these new possibilities, and the corpus was once again examined for diagrams that would challenge the current iteration of the catalog. This process was continued until all of the differences in diagrams we encountered in the corpus could be captured with existing choices (or by adding subchoices) in the systems. In total, diagrams from 22 textbooks—the earliest published in 1913, the latest published in 2001—were examined to develop the structure and categories in the catalog described below. The earliest books in the sample are from 1913 because it was not normative for geometry textbooks to include proving exercises for students to do until after 1910 (Herbst, 2002). The textbook published in 2001 was the upper limit because it was a typical example of a mainstream textbook that was in use in geometry classrooms at the time the study was conducted. In order to build the semiotic catalog, we surveyed the textbooks in the corpus holistically to ensure that the framework we developed could account for the widest possible range of visual variation in diagrams.
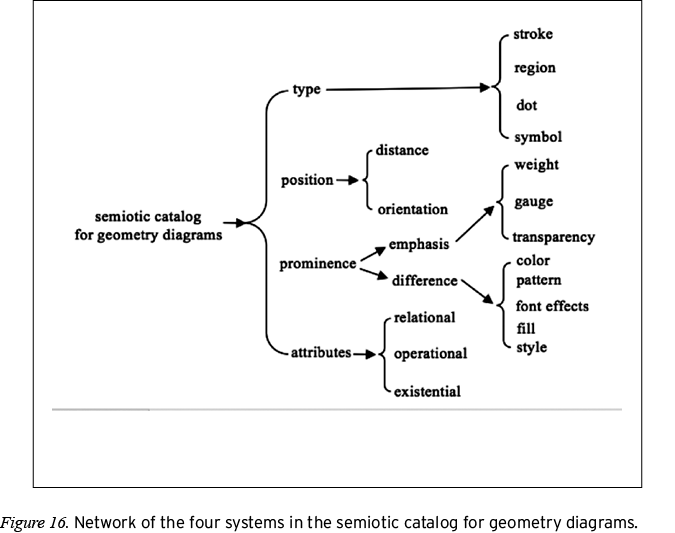
The categories in the systems and subsystems within the semiotic catalog reported below were built on theoretical footings laid by researchers working in social semiotics. In what follows, we elaborate on these theoretical connections as we report the findings of the semiotic inquiry. The results of the inquiry are presented via annotated networks that catalog the semiotic resources of geometry diagrams as choices in four functional semiotic systems. We identified these as the Type, Position, Prominence, and Attributes systems. The annotations of each network describe the rationale for the system and draw explicit analogies to systems in functional grammar. Additionally, we consider how the Type, Position, Prominence, and Attributes systems of geometry diagrams convey visual analogs of the ideational (visually: representational or experiential), interpersonal, and textual (visually: compositional) metafunctions of texts (Alshwaikh, 2011; O’Halloran, 2005).
For the purpose of this analysis, the parts of a geometry diagram are graphical analogs of morphemes in written language (von Engelhardt, 2002). In geometry diagrams, there are parts that represent geometric objects (e.g., dots, strokes, regions) and parts that represent geometric or other mathematical properties (e.g., symbols for congruence, symbols for movement). The Type system organizes these visual parts into a network of systemic choices.
The Type system. The Type system takes stock of the visual parts of a diagram. Figure 5 is a representation of some of the choices in the Type system.

Stroke refers to the parts of a diagram that can represent lines, line segments, and rays (straight strokes) or curves (non-straight strokes). A key element of the literacy necessary to accurately read a diagram is that different geometric objects can be realized by parts that are visually similar. In some cases, the kind of geometric object that is represented by a stroke is tacitly conveyed by the visual relationships of the parts in the display, such as reading the strokes that make up a three-sided plane figure as segments (as opposed to lines or rays). In other cases, arrows may be applied to one or both ends of a stroke to indicate what kind of geometric object is being represented, such as when endpoint arrows are added to a stroke to show that it represents a line. The semantic function of such endpoint arrows is described in the Attributes system.
Region refers to parts of a diagram that can represent planes (unlimited), plane figures (totally limited) and angles or half-planes (partially limited). Even though some regions in diagrams can be described by the strokes that comprise their boundaries, we include region as a separate choice in the Type system to provide a means for referring to regions without needing to resolve them into their constituent parts. This helps to accommodate a range of different diagrammatic texts that can be constructed from the same set of visual building blocks. An example of a totally limited region {region: limited: totally limited} would be a diagram of a polygon, but an example of a partially limited region {region: limited: partially limited} would be an angle.
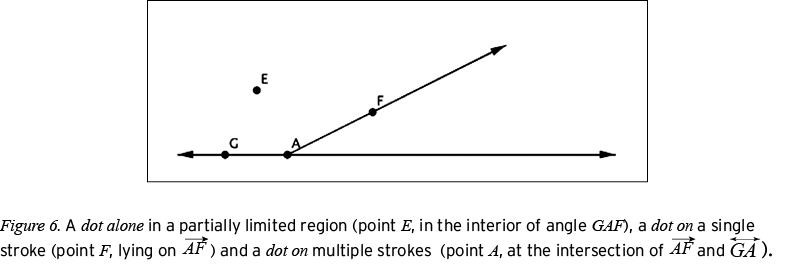
Dot is the visual category that corresponds to geometric points. The dot-alone/dot-on distinction captures the visual differences between dots that are visually independent5 of other parts (e.g., a dot that appears on its own to represent a point in some limited or unlimited region) and dots that are used to visually mark specific locations on other parts (e.g., a dot on a stroke to represent a point on a line or a dot that appears on several strokes to indicate the places where two or more strokes intersect). Figure 6 shows an example of some of the different choices for dots and regions.
Concluding the first level of the Type system, symbols are those units of a diagram that (a) provide resources for making statements about (or with) the geometric objects a diagram represents or (b) convey the geometric relationships or operations that are realized by a diagram. Alphabetical and numerical symbols include labels (e.g., Greek or Latin letters applied to dots or strokes, as in the labels A, E, and F applied to the dots in Figure 6; numbers applied to partially limited regions) and captions, but mathematical symbols (e.g., small squares to mark right angles, arrows to indicate a rotation, construction traces, or algebraic operations that are nested within labels) are the resources through which geometric properties and mathematical operations are communicated by the diagram.
Through choices in the Type system, geometry diagrams realize what O’Halloran (2005) called the compositional metafunction: the visual analog of the textual metafunction that signals to a viewer how a visual image coheres as a meaningful text. For example, an arrangement of four strokes in a regular, four-sided figure with unlettered corners accompanied by a label that says “square” cues a diagrammatically literate viewer to read the diagram as a representation of a whole figure (in this case, a square) as opposed to a collection of independent parts. Alternatively, three individually lettered dots appearing on a stroke that has its own label is a cue that the diagram is a representation of the relationships among its parts (in this case, it could be the potential betweenness relations that hold among the lettered dots).
The possibilities for Type shown in Figure 5 are not exhaustive but rather indicate the first-level choices within this system. From those initial choices, it would be possible to chart more delicate choices within the Type system as well as expand the choices to include diagrammatic texts in other mathematical domains. For instance, one could elaborate more choices within the category of non-straight strokes {strokes: non-straight} by considering different types of non-straight strokes. The initial levels of the Type system shown in Figure 5 provide a framework that could be extended as necessary to analyze diagrams.
In addition to carrying compositional meaning, the Type system also carries representational (O’Halloran, 2005) meaning: the visual analog of ideational meaning in language. That is, even in the absence of special markup signs—described below as diagrammatic Attributes—strokes, dots, and regions are sufficient to convey relationships that hold among the different geometric objects that are represented in a diagram. Properties like incidence, order, separation, betweenness, or adjacency relations have a long history of being represented in diagrams solely through different configurations of the available visual parts (Manders, 2008). Analyzing changes in how the representational metafunction is realized through the Type system was not a focus of this study, but we note that this would be an area for further research.
The Position system. The Position system captures how the parts of a geometry diagram relate to each other spatially (i.e., how parts are located relative to one another and how those parts are oriented relative to the frame of reference of the page). Figure 7 shows a representation of some of the choices in the Position system.
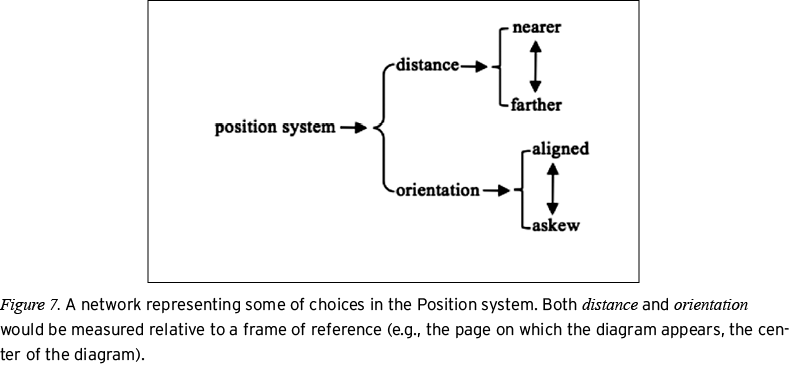
The choices in the first level of the Position system are relative to a frame of reference (e.g., radial, rectangular). Distance refers to the space between parts, and orientation refers to the heading (e.g., compass angle) of a part in the diagram relative to a set of reference axes. Although the network representation of the Position system shown in Figure 7 depicts both nearer and farther as well as aligned and askew as discrete choices, these are more like the names for extremes of continua (i.e., parametricsystems; see van Leeuwen, 2009) with intermediate choices available as needed, which are represented in the network by vertical arrows (van Leeuwen, 1999).
The orientation of geometric figures and how changes in orientation influence the perception of a figure has been of interest to psychologists (e.g., Attneave, 1968; Driver, Baylis, Goodrich, & Rafal, 1994; Palmer, 1980; Rock, 1973), mathematics education researchers (e.g., Clements & Battista, 1989), and philosophers of mathematics (e.g., Giaquinto, 1992). Palmer’s (1980) work on the directions in which different types of triangles and groups of equilateral triangles point suggests that how the parts of the visual display are oriented relative to one another and to the reference axis of the page has some effect on how objects are perceived, a finding that is echoed by Clements and Battista’s (1989) account of some children’s conceptions of angle being linked to the orientation (with respect to the page) of otherwise visually identical objects—for example, for some children, a vertical line is not an angle, but a diagonal line is.
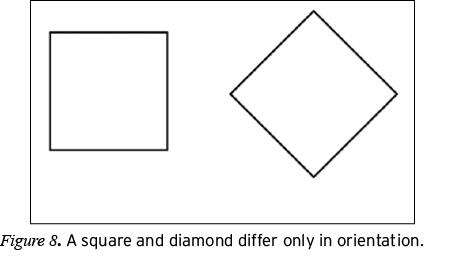
Changes in the orientation of a diagram can affect what a diagram represents. An example is the difference between a square and a diamond (Giaquinto, 1992). A square and a diamond have the same types of parts arranged in the same way (so, compositionally, they both cue the reader to read the visual strokes as representing some complete whole as opposed to a collection of independent parts), but one is oriented to align with the axes of the page, and the other is offset from alignment with these axes by a quarter turn (see Figure 8). That the orientation of a figure affects how a diagram of a figure is read suggests that the Position system, like the Type system, provides a set of choices for realizing the compositional metafunction of geometry diagrams. That the Position system carries the visual analog of the textual metafunction is consistent with O’Halloran (2005), who stated that the spatial proximity (distance) and arrangement (including orientation) of the different parts of a mathematical visual image are markers that realize the compositional (i.e., textual) metafunction.
The Prominence system. From O’Halloran’s (2005) multimodal study of mathematical discourse, we initially had reason to believe that geometry diagrams would have a system for conveying varying degrees of visual emphasis to different parts of the diagram—a carrier of the interpersonal metafunction that O’Halloran described as the prominence of a mathematical image in the display pane. This led us to consider having a system for prominence as one of the systems in the catalog for geometry diagrams.
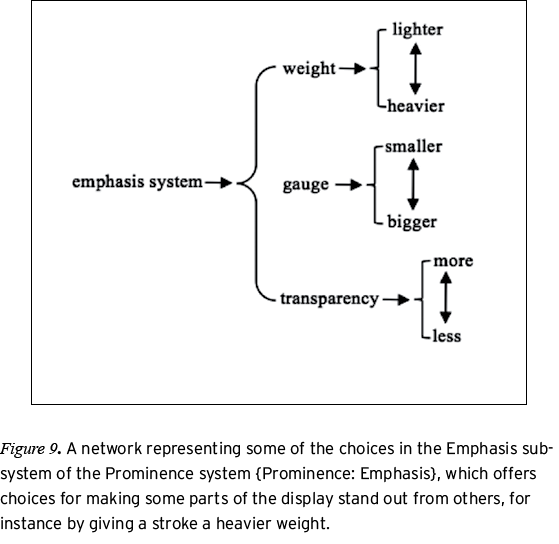
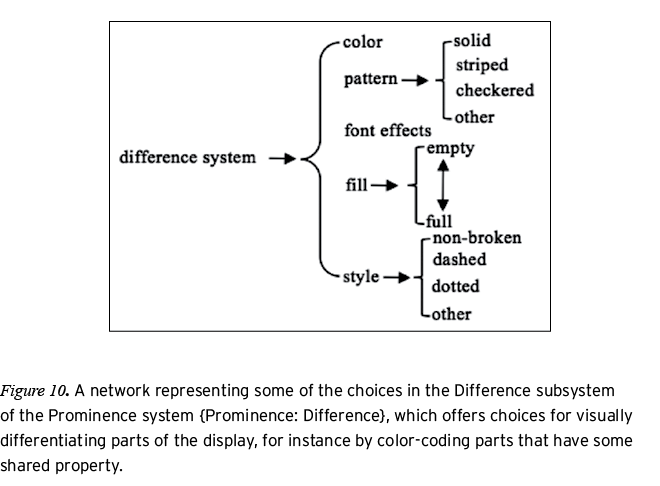
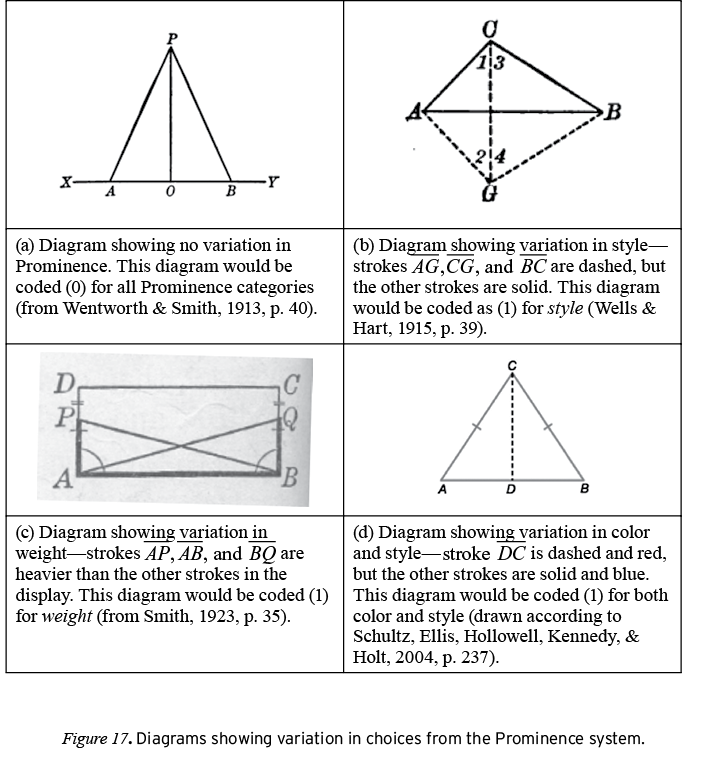
The Prominence system describes the visual presence of a part in the display (O’Halloran, 2005). The Prominence system has two subsystems: Emphasis and Difference. The Emphasis subsystem conveys the visual salience of a part through choices for weight (strokes), gauge (dots), and transparency (regions). The Difference subsystem conveys membership in different categories through variations in color (all parts), pattern (regions), fill (dots), style (strokes), and font effects (symbols). Thus, diagrammatic units that are given equal salience can be distinguished as belonging to different categories through choices in style (dashed, dotted, etc.) for strokes, fill (solid, cross-hatched, empty) for dots, different colors, or different patterns of shading (solid, checkered, striped, etc.) for regions. Figures 9 and 10 show representations of some of the choices within the Prominence system for geometry diagrams. Figures 11 and 12 show diagrams that realize choices in the Emphasis and Difference systems. The diagram in Figure 11 shows variations in gauge and fill that visually mark different points. Figure 12 shows a diagram in which variations in color and weight group related strokes.
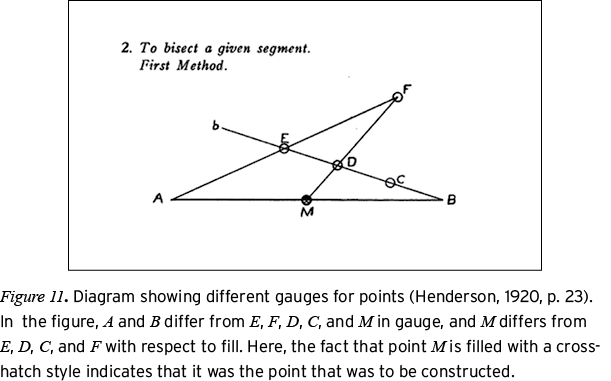

In Figure 11, points E, F, D, C, and M are made visually distinct from points A and B by the fact that these points are marked by a dot that has nonzero gauge. Within the equally emphasized set of points (E, F, D, C, M), there are differences that are marked by choices in fill: Point M is filled in with a cross-hatch style, but points E, D, C, and F are open. In Figure 12, circle C (Figure 12b) is given less emphasis relative to strokes  by virtue of its lighter weight, yet it is linked to
  —while also being set apart from
 —through choices in color.
In Foster, Cummins, and Yunker’s (1987) Merrill Geometry, blue is the default color choice for given strokes; other colors (orange, red, purple) are used to mark auxiliary or otherwise special lines. This suggests that  (colored darker in Figure 12b) is an auxiliary line. Contrast this to the way parts are made visually salient in in Wentworth and Smith’s (1913) Plane Geometry. In this text, solid strokes were typical, and the dashed style was used to mark auxiliary lines. The radii in Figure 12a
  are marked as different from the other strokes through a choice in style (dashed), suggesting that the radii are the auxiliary lines in this diagram.
These examples show that the Prominence system can indicate how the different parts of the diagram could be used when writing proofs or completing tasks. Other uses of Prominence include applying heavier stroke weights to parts that are given, as in Baker’s (1902) scheme, or emphasizing particular points by marking them with dots. Gal and Linchevski (2010) described teachers’ intuitive uses of heavier stroke weights as a resource for highlighting the important segments of a diagram, such as those that are shared by several plane figures.
The use of Prominence helps to structure a viewer’s visual interaction with the diagram. When diagrams have parts that are differentiated by heavier strokes, dashed strokes, different colors, or marked points, these variations can communicate the visual analogs of the imperative (“look here”), interrogative (“will this help?”), and declarative (“this is important”) mood, which are some of the linguistic resources for realizing the interpersonal metafunction (Lam & Webster, 2009).
The Attributes system. The Attributes system is a collection of symbols through which a diagram may explicitly (and directly) convey the geometric properties of the objects it represents. Figure 13 shows a representation of some of the choices in this system.
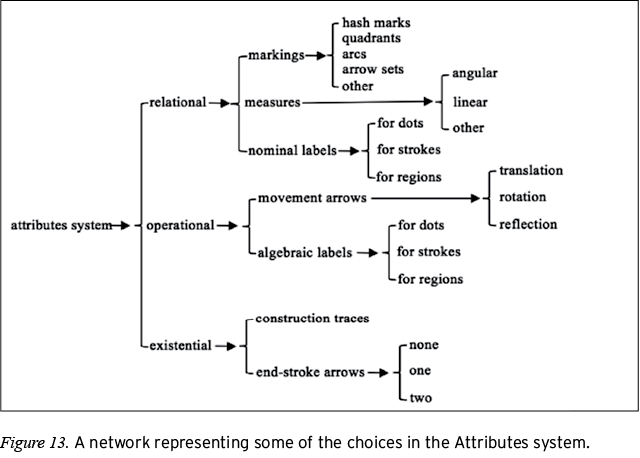
Attributes can be relational, existential, or operational. These distinctions draw an analogy to the system of Transitivity in lexicogrammar (Halliday & Matthiessen, 2004). At its most basic unit, a clause can be divided into three parts (process, participants, and circumstances), which “are organized in configurations that provide the models or schemata for construing our experience of what goes on” (Halliday & Matthiessen, 2004, p. 175). The Transitivity system has choices for different process types, and through these choices, the experiential metafunction of a text is construed. Experiential meaning concerns statements about things in the world, from concrete things like trees and water to abstract things like thoughts and feelings. Different types of processes (e.g., material, mental, relational) are chosen to convey the experiential meaning about different types of things (Eggins, 2004).
The Attributes system has choices through which diagrams visually realize analogs of relational and existential processes. Relational processes characterize and identify. In the case of geometry diagrams, relational processes are realized through markings, measures, and nominal labels. These resources identify and classify relations that hold among specific parts of a diagram.
Relational markings are the symbols that convey geometric properties when they are applied to parts in the geometry diagram. This set of symbols includes the small squares (i.e., quadrants) that indicate right angles, small arcs that indicate congruent angles, hash marks that indicate congruent segments, and sets of arrows that indicate sets of parallel lines. These markings are resources through which the diagram directly communicates geometric properties without any supporting literal or symbolic statements. Thus, an angle marked by a quadrant is a right angle, regardless of whether it is visually perceived as a right angle (see Gal & Linchevski, 2010). We refer to relational markings as geometric diacriticals because they signal geometric properties of objects in diagrams analogously to the way that diacritical markings (e.g., accents, tildes, umlauts) signal phonetic properties of letters in words.
Measures are the characters (including numerals, letters, and symbols that abbreviate units of measure) that are used to indicate quantity in diagrams. Angular measures could be in degrees, radians, revolutions, or other units that describe the amount of rotation of a ray around a reference axis. Linear measures could be in terms of meters, feet, or the units of any other distance metric. Other measures would capture anything not covered by linear or angular measures (e.g., counts of the number of points of intersection between different geometric objects). Measures are relational attributes in that they classify quantitative having or being relationships (Eggins, 2004) among the parts in the display. For example, the linear measures of any two segments in a diagram convey that each segment has the indicated measure, while at the same time classifying segments as relating to each other by virtue of being equal, when the measures are the same, or being unequal, when the measures are different.
Nominal labels are resources through which diagrams identify geometric objects that are represented in the diagram. Labels for strokes are generally lowercase letters (script letters for lines or rays, plain letters for segments or arcs), labels for regions (e.g., angles) are generally numerals but could also be Greek letters, and labels for dots are generally capital letters. Using different conventions for labeling different types of parts helps to provide clear referents for labels without having to add additional marks (e.g., arrows, brackets) that anchor labels to what they are labeling. Nominal labels are thereby a resource through which visual realizations of dots, strokes, and regions may be identified as points, lines, and planes.
Complementing relational attributes are existential attributes. Existential processes are those “by which phenomena of all kinds are simply recognized to ‘be’” (Halliday & Matthiessen, 2004, p. 171). Like their linguistic analogs, existential attributes of the diagrammatic register stipulate the existence of a part in a diagram. Arrows serve as existential attributes when they are applied to the ends of straight strokes, as a means of stipulating that a given straight stroke is a line (two arrows) or a ray (one arrow). Construction traces serve as existential attributes that stipulate the existence of points on which a construction protocol depends.
In addition to existential and relational processes, O’Halloran (2005) defined an operative process type that is specific to mathematical discourse. Operative processes are realized either by dedicated symbols like + or by lexical elements of the mathematical register (e.g., words that in mathematics mean an operation, such as plus, added to, along with, put together, etc.). The operational attributes identified in Figure 13 realize operative processes in geometry diagrams, such as when angles or segments are labeled with algebraic expressions (e.g., 4x + 3 and 2x + 7) in geometric calculation problems (i.e., those in which students are asked to find measures of angles or sides of a figure after solving for x; see Hsu, 2010; Hsu & Silver, 2014). Operative processes are also present in diagrams through arrows that are used to mark rotations or other movements.
There are further choices within the Attributes system that are not shown in Figure 13. For example, the other category under markings could have choices for symbols such as exclamation points or question marks—resources that are used in some textbooks to differentiate information that is given from that which is to be proved (see Moise & Downs, 1982). Figures 14 and 15 provide examples of the different ways that Attributes can be applied to diagrams.
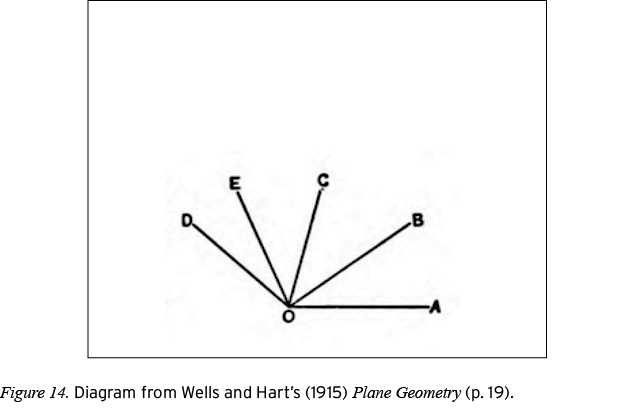
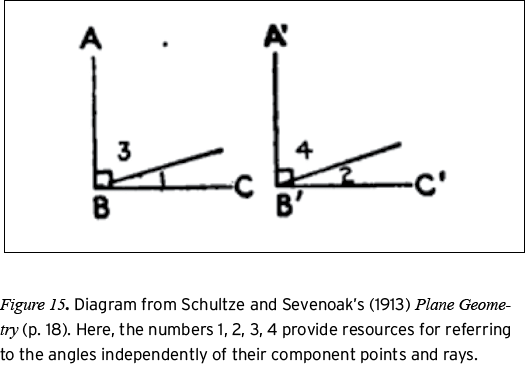
The labels on the ends of the strokes in Figure 14 are sufficient to stipulate the existence of points, even in the absence of other visual signs such as dots. In Figure 15, four distinct angles are identified by way of the labels 1, 2, 3, and 4. Furthermore, these labels provide the only resources for unambiguously referencing these angles because the strokes in between  and
and  as well as
 and
and  do not have labels at one of their ends.
The semiotic systems of geometry diagrams. We have described four systems of geometry diagrams and explored their connections to the ideational (representational and experiential), interpersonal, and textual (compositional) metafunctions. Figure 16 shows a network representation of all four systems and their first-level choices.
The current study considers realizations of diagrams in geometry textbooks. However, we contend that the semiotic treatment we propose could be used as a basis to develop a broader framework that could describe semiotic interactions with other geometry diagrams, such as diagrams produced using different tools—for example, diagrams drawn freehand, with constructions tools, or using dynamic geometry software such as GeoGebra (Hohenwarter & Preiner, 2007)—by teachers and students in classrooms. In textbook diagrams, Prominence is realized through the use of different visual accents to highlight key features of a diagram, such as heavier (thicker) stroke weights. At the chalkboard, this emphasis function might be more naturally fulfilled using metadiagrammatic markings, such as circling the key part of a diagram, or through changes in the tone or volume of one’s voice when referring to that part of the diagram (van Leeuwen, 1999). In either case, a semiotic resource (circling, volume) is used to deliver the emphasis, carrying the interpersonal message “pay attention: this part of the diagram is important.” This is not to suggest that such a multimodal expansion of the systems we have proposed would be automatic or trivial but only to highlight that the possibility of such an expansion would be consistent with other multimodal extensions of social semiotics (Alshwaikh, 2011; Jewitt & Kress, 2003; Kress, 2010; O’Halloran, 2008). We now turn to reporting on how we used the semiotic catalog described above to conduct a semiotic inventory of diagrams from 20th-century geometry textbooks.
A Semiotic Inventory of Diagrams in 20th-Century Geometry Textbooks
Textbooks are enduring representations of school mathematics that provide stable, analyzable records of mathematics curriculum. Because “no direct evidence of what was taught in the nation’s classrooms of the past is available” (Baker et al., 2010, p. 385), it has been relatively common in mathematics education to analyze textbooks to document historical changes in the curriculum (e.g., Baker et al., 2010; Fujita & Jones, 2003; Herbst, 2002; Van Sickle, 2011). The diagrams in geometry textbooks published at different times are thus partial records of the intended curriculum (Mesa, 2004) that provide a “critical link between the intended and attained curriculum” (Thompson, Senk, & Johnson, 2012, p. 254).
The semiotic catalog that we describe in the first part of the article suggests dimensions along which visual differences in geometry diagrams could be empirically studied. Because the presence or absence of particular visual features in a diagram—for example, the use of different colors; the use of symbols to mark properties; the presence of different types of labels—constrain how a diagrammatic text conveys meaning, tracking differences in these visual features across textbooks provides a gauge of how the diagrams in geometry textbooks have changed, as texts, over time. Furthermore, if the choices that we identify in the semiotic systems of the diagrammatic register were analytically viable as a means to chart trends in the apparent visual differences in a corpus of textbook diagrams, it would lend credence to our claim that the semiotic catalog we developed is a useful theoretical framework for analyzing geometry diagrams as visual texts.
The general purpose of the empirical part of the study (i.e., the corpus study) was to determine the usefulness of the semiotic catalog for geometry diagrams as a framework for conducting empirical analyses. The specific goal of the corpus study was to chart how diagrams in geometry textbooks have changed as visual texts over the course of the 20th century. The research question that motivated the corpus study was: How have diagrams in geometry textbooks evolved as texts during the 20th century?
A Method for Inventorying the Semiotic Resources of Geometry Diagrams
To study the realizations of semiotic systems in 20th-century geometry textbooks, we developed an inventory scheme that operationalizes the semiotic catalog for geometry diagrams described in part 1. The unit of analysis for the coding was a diagram, and the different inventory codes indicate the presence (1) or absence (0) of specific visual qualities realized in the diagrams in the corpus. We made the semiotic catalog operational by using the Type system (compositional metafunction) to identify the parts of a diagram to which choices in the Promience and Attributes systems applied. Through the Prominence and Attributes systems, diagrammatic texts convey both experiential or representational (Attributes) and interpersonal (Prominence) meanings directly to a viewer. We did not undertake a large-scale inventory of choices in the Position system because the sheer volume of parts to code—and their distances and orientations to measure—per diagram made such work infeasible, though examing how changes in the Position system affect the meaning potentials in diagrams is a direction for further study.
The inventory scheme consisted of two classes of codes. The first class of codes included indexing and diagram metadata—for example, references to locate a diagram within a textbook as well as information about the section in the textbook in which the diagram appeared (e.g., What unit, subunit, or section did the diagram appear in?). The indexing scheme used page numbers and left–right, top–down position to index the diagrams in a given textbook: On a given page, the top/left-most diagram was indexed as “p.1” (where “p” is the page number), and the next top/left-most diagram was indexed as “p.2” (e.g., 41.2), continuing until every diagram on the page was entered into the index for that textbook. Other metadata that were recorded about each diagram were the unit, subunit, or section in which it appeared, according to how that section was defined in a textbook. The purpose of gathering diagram metadata was to enable comparisons across textbooks using the metadata as a control.
The second class of codes inventoried the use of resources from the Prominence and Attributes systems. We developed a coding scheme that in principle spanned the choices in the semiotic catalog for the Prominence and Attributes systems, but in practice only a subset of the choices were realized in diagrams in the corpus that we analyzed for this study. The use of the Prominence system in geometry diagrams was investigated with codes that track variations in the use of weight, style, and color within the parts of a diagram. The use of the Attributes system in geometry diagrams was investigated with codes that track the use of relational markings and labels. The codes within the Prominence and Attributes systems and their interrater reliabilities are explained in the next sections.
Coding for Prominence. The use of the Prominence system in geometry diagrams was investigated by coding for differences in the weights, styles, and colors of the strokes that appear in diagrams. The other choices in the Prominence system identified in Figures 9 and 10 were present in the inventory scheme but were rarely realized in the diagrams in the corpus study. For Prominence, a feature was marked as present in a diagram if the diagram contained at least two parts that varied their use of that feature (e.g., a diagram that had one solid line and one dotted line would be coded as a 1 for style). Figure 17 shows examples of diagrams that feature different uses of prominence.
Coding for Attributes. For the Attributes aspect of the corpus study, we inventoried how diagrams in the corpus used nominal labels (e.g., labels for points, lines, angles, or other labels) and relational markings (the symbols that indicate congruence, perpendicularity, and parallelism) as a means of tracking the different types of relational clauses (Halliday & Matthiessen, 2004) that are realized in diagrammatic texts. In language, relational clauses identify or classify. Identifying relational clauses have the form “a is the identity of x” (Halliday & Matthiessen, 2004, p. 216) and are reversible—for example, “Sarah is the leader; the leader is Sarah” (p. 216)—but classifying relational processes have the form “a is an attribute of x” (p. 216) and are not reversible—for example, “Sarah is wise” (p. 216).
In geometry diagrams, the presence of a label applied to a part in the display may be seen as a visual identifying process that has the form “(this part) is an x”—where “x” is a point, line, angle, or other geometric object, depending on the visual qualities of the part or label. The presence of different kinds of relational markings in a diagram likewise may be seen as visual classifying processes that take the form “(these parts) are x”—where “x” is congruent, perpendicular, or parallel, depending on the visual qualities of the marks. Thus, the choices under nominal labels and relational markings in the Attributes system provide means for describing the visual clause-making potentials of a diagram.
Within the category of labels, there are labeled points; unlabeled points; and labels for angles, strokes (including curved strokes like arcs), and regions (e.g., a plane). We coded for labels in a diagram using dichotomous codes that indicated whether an object was accompanied by a label. There were two groups of codes: those that applied to points and those that applied to strokes, angles, and regions. Points were a special case because we coded for the presence of both labeled and unlabeled points in a diagram; for other parts, only the existence of special labels was recorded. To avoid trivializing the unlabeled point code, an unlabeled point was defined as an unlabeled intersection of two or more strokes (e.g., the unlabeled intersections in parts (a) and (b) of Figure 19). Both labeled and unlabeled points were coded because letters on points allow one to refer to parts other than points. Figure 18 provides an illustration of this.
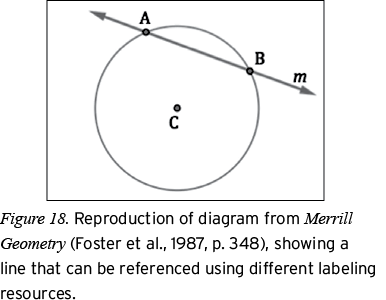
In Figure 18, one could refer to the line that intersects the circle as “line  ” or as “line m.” The labels for A and B also allow the identification of rays
  and
and  and one could even use A and B to name major
 and minor
  arcs of circle C or to refer to segments
  and
and  that are not marked by strokes. The presence of labeled points in Figure 18 highlights the utility of labeled points for identifying the geometric objects in a diagram. However, the potential to use points to identify different types of objects presents a challenge for inventory coding: If a line is identifiable only by naming two points it contains, is the line labeled or unlabeled? Identifying such lines as labeled would mean, essentially, that any diagram with labeled points would have labeled lines, but identifying such lines as unlabeled would create a deficiency where there really is none. The same challenge exists for segments, rays, arcs, angles, or other objects that can be identified by naming a sequence of points. An alternative is simply to note when a diagram makes use of dedicated labels to refer to one of its parts—such as the use of the letter m to label the line in Figure 18—while also coding for the presence of labeled and unlabeled points. Taking stock of dedicated labels avoids trivializing when a diagram has other labeled parts without departing from traditional labeling practices. Therefore, this is what we chose to do.
Within the category of markings, there are codes for marked properties, unmarked properties, and diagrammatically marked properties. We define marked properties to be those properties that satisfy three conditions:
• Condition A:The property is given by a statement (through words or symbols) that accompanies the diagram—such as the statements of what is given that can accompany diagrams for proof problems.
• Condition B: There is a geometric diacritical through which that property is able to be marked in a diagram (e.g., hash marks that indicate congruence, arrows that indicate parallelism).6
• Condition C: The given property is marked in the diagram.
We define unmarked properties to be those properties that satisfy Conditions A and B but not Condition C: It is a property that is stated (through words or symbols) as holding in the diagram and for which there is a geometric diacritical that could be used to mark it, but this marking is absent from the diagram. Unmarked properties are distinct from what we call nonmarkable properties—those properties that satisfy Condition A but not Condition B. Nonmarkable properties are properties for which there is no geometric diacritical that marks when the property holds in a diagram. That two angles are adjacent angles is an example of a nonmarkable property. Finally, we define diagrammatically marked properties to be those properties that satisfy Conditions B and C but not Condition A—theoretical properties of geometric figures that are conveyed solely through geometric diacriticals. Figure 19 illustrates the differences between unmarked, nonmarkable, marked, and diagrammatically marked properties of diagrams.7
The conditions of being unmarked (n), marked (m), or diagrammatically marked (d ) apply to congruent angles, right angles, congruent segments, and parallel lines—the properties for which there are geometric diacriticals that can be applied to the parts of the display to indicate that these properties hold in a diagram. Because the unit of analysis is a diagram, these geometric objects were inventoried using dichotomous ordered triples. Using an ordered triple of dichotomous codes—where n, m, and d can each take the value of 0 or 1, depending on the absence or presence of a part with that property in a diagram—allowed us to distinguish different realizations of marked, unmarked, and diagrammatically marked properties within the same diagram. For example, a diagram could have more than one right angle. Each right angle would either be unmarked, marked, or diagrammatically marked, and applying the n, m, and d codes dichotomously across the diagram would record the different cases of how the property of being a right angle is realized.
Reliability of the Inventory Scheme
Two coders tested the reliability of the inventory scheme. For this reliability testing, coders were provided with a coding manual that (a) defined each code in the scheme and (b) illustrated each code with examples and nonexamples. The coders used the scheme to code 20 diagrams as a way of calibrating their application of the codes in the scheme. During this calibration phase, any disagreements about the application of a code were discussed until resolved. After the calibration was finished, the coders used the scheme to independently code 48 randomly sampled diagrams from 10 randomly sampled textbooks.8 Table 1 reports the resulting reliability statistics (Cohen’s Kappa) for these codes.
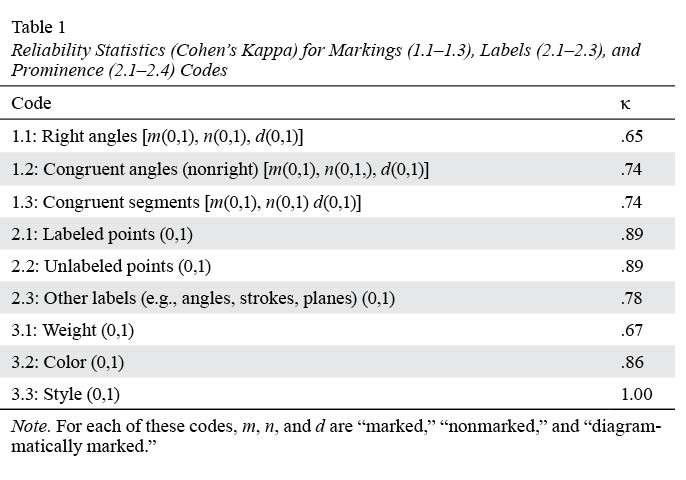
The Kappa statistics for the codes reported in Table 1 range from .65 to .89, indicating interrater reliabilities that range from “moderate” to “almost perfect” (Muñoz & Bangdiwala, 1997). The Prominence code for shade (0,1) that applies to regions and the Attributes code for parallelism [n(0,1), m(0,1), d(0,1)] that applies to strokes are not reported in Table 1. These codes exhibited, respectively, perfect (1.00) and near perfect (.96) agreement between coders; however, these high rates of agreement did not differ from the agreement expected by chance—meaning their Kappa statistics are 0. These codes exhibited high rates of chance agreement because almost all of the diagrams in the reliability study sample were recognized by both coders to be in the (0,0,0) category for parallelism (46 of 48 diagrams) and the (0,0) category for shade (48 of 48 diagrams). The categories in the scheme were defined to capture the widest possible range of variation in diagrams, yet the possibility of a difference does not entail the actuality of that difference. Thus, the null Kappa statistics are artifacts of the sample of diagrams used in the reliability study (i.e., diagrams that exhibited variation in style or the use of parallelism markings were rare in the sample) rather than indictments of the codes (Cicchetti & Feinstein, 1990).
Data Sources
We applied the inventory scheme to 20th-century geometry textbooks. Twenty-two geometry textbooks from major publishing houses were selected for analysis: 10 of the textbooks were from post 1950; 12 of the textbooks were from before 1950. To control for the variation in content from textbook to textbook, we inventoried diagrams from each textbook that were listed under chapters, units, or sections that covered triangles, triangle congruence, and proofs involving triangles. We chose diagrams about triangles because the geometry of the triangle is a canonical subject for which theoretical development was comparable across the textbooks in the sample—for example, there was a set of postulates, definitions, and theorems about triangles that were common to each textbook in the set. Selecting content for analysis from a standard unit of the typical curriculum is a rationale that has been used in prior investigations of historical changes in textbooks (Lee, 2010). Table 2 lists the textbooks in the sample, sorted by year, with totals and descriptive statistics for the number of diagrams analyzed in each textbook.
Data Analysis and Results
The inventory scheme9 generated data that could be used to describe trends in how diagrammatic texts were visually realized in the textbooks we analyzed. Because we conceptualized observable differences in the visual features of geometry diagrams as variations in semiotic choice and coded these differences as they presented in different geometry textbooks, it is reasonable to analyze the inventory data using techniques from corpus linguistics in which lexical or grammatical elements of text corpora are tallied, absolute and relative frequencies of occurrence are calculated, and statistical testing is used to identify significant relationships (Chotimongkol & Rudnicky, 2001; Gries, 2010; Pagel, Atkinson, & Meade, 2007).
To control for the fact that newer textbooks, in general, have more diagrams than older textbooks, we normalized the inventory codes across the sample of textbooks by calculating the percentage of diagrams that realized choices in the Prominence and Attributes systems. In the next sections, we describe the variables that were derived from the inventory codes and report Pearson’s correlation coefficients between these variables and date of textbook publication.
Analysis of the Prominence system. To gauge how geometry diagrams realize the interpersonal metafunction, we tracked variations in weight, style, and color in diagrams throughout the textbooks in the corpus using the codes for Prominence defined above. We normalized these tallies into percentages of diagrams (per textbook) that showed variations in weight, style, and color.10 Figure 20 shows scatter plots of each of these variables and year of publication for the textbooks in the corpus. There was a significant positive correlation (r (20) = .713, p .001) between the percentage of diagrams showing variation in color and textbook year, indicating that, as year of publication increased, the diagrams in the corpus increasingly exhibited variations in color. There was a significant negative correlation between year of publication and the percentage of diagrams showing variation in style (r (20) = -.745, p
 .001) and no significant correlation between year of publication and percentage of diagrams showing variations in weight. Together, these correlations suggest that, as year of publication increased, variations in color played a larger role (compared to style and weight) in realizing the interpersonal metafunction of diagrammatic texts. O’Halloran (2005) argued that color is used in mathematical visual images as a resource for drawing and directing a viewer’s attention, a claim echoed by Gal and Linchevski (2010) in their analysis of student perceptual difficulties with diagrams. Gal and Linchevski identified color—along with variations in line thickness (i.e., weight)—as a resource that can help students identify parts of a diagram that are similar to each other, such as segments in a diagram that are shared by multiple plane figures or parts in a diagram that are congruent (Alshwaikh, 2011; Lin, 2005).
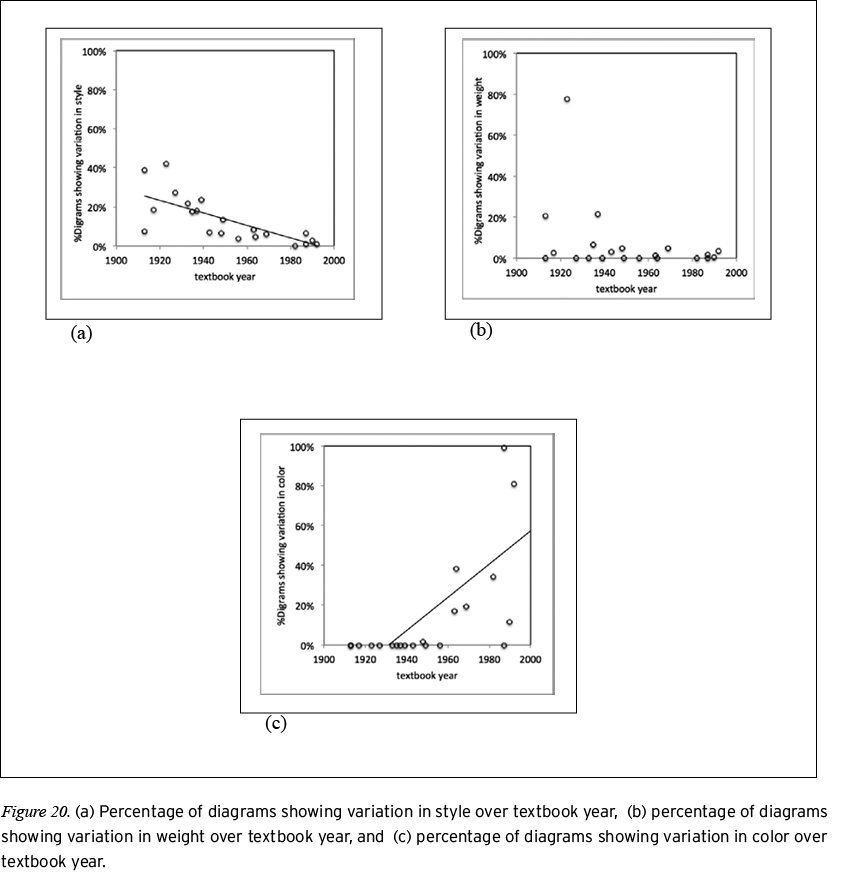
Diagram coloring has “been used intuitively in the teaching of geometry for years” (Gal & Linchevski, 2010, p. 171). The greater availability of color as a resource for creating diagrams in textbooks over the last half of the 20th century (LaSpina, 1998; Woodward, 1993) is a move toward bringing the intuitive practices of coloring diagrams into the written record of the curriculum. Still, teaching students to use color as a resource when creating or reading diagrams and helping teachers to make explicit the intuitive strategies they employ for using color to represent related parts of a diagram are open challenges for mathematics educators. Gal and Linchevski (2010) argue that a visual-processing perspective on the role that color plays in how diagrams are perceived is a step toward providing such professional instruction. We would add that a semiotic perspective, such as the one that we have provided, on the ways that color can be used as a resource for guiding and directing a viewer’s attention also provides an essential scaffold for such instruction.
Analysis of the Attributes system. The Attributes system provides semiotic resources through which diagrams can visually declare the geometric relationships they represent. The relationships between the parts of a diagram are realized through identifying and classifying relational processes. We tracked the potential for diagrammatic identifying clauses by coding for the presence of labeled points, unlabeled points, and other types of labels, and we tracked the potential for diagrammatic classifying clauses by coding for unmarked, marked, and diagrammatically marked properties.
How labels are used in diagrams in geometry textbooks. Labels provide resources that facilitate naming and referencing parts of a diagram. A labeled part, such as numerals (e.g., 1, 2, 3) for angles, identifies to viewers that the labeled part is a visual realization of a specific geometric object. Thus, labels are semiotic resources that give rise to identifying relational processes in diagrammatic texts. Diagrams that have different types of labeling resources (e.g., those for points, lines, planes, and angles) provide more choices for making identifying clauses in which the participants are geometric objects. For example, a diagram with both labeled points and labeled lines enables clauses that identify lines either by using their dedicated labels or by using the labels of points that are on the line.
We defined three classes of diagrams from the inventory codes for labels: those in which all of a diagram’s points are labeled, those in which none of its points are labeled, and those that contain only other labels (e.g., labels for angles, strokes, or regions but no labels for points). Diagrams that have all of their points labeled would allow a viewer to specifically reference any geometric object in the visual display (i.e., all points, lines, segments, planes, plane figures, arcs, or angles could be identified by sequences of labeled points). In effect, labeled points can be used to reference specific geometric objects without resorting to gesturing or to positional or conceptual language (e.g., top segment and base angles, respectively). By contrast, diagrams that have none of their points labeled require viewers to use concepts (e.g., the base angles), other resources (e.g., gestures), or other labels (e.g., labeled angles) to reference the geometric objects the diagram represents. Finally, diagrams that only have other labels are those diagrams that do not have any labeled points yet provide other labels for identifying objects in the display (e.g., labels for angles, labels for lines). Figure 21 shows scatter plots of percentages of diagrams in a textbook in each of these classes of diagrams against year of publication for the textbooks in the corpus.
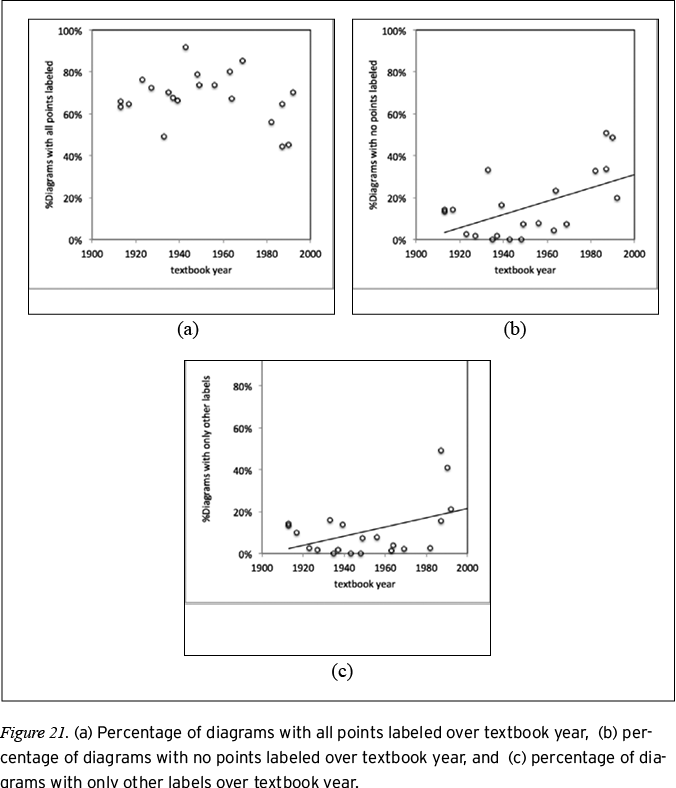
As year of publication increased, there was a significant increase in the percentage of diagrams that did not have labels for any of their points (r (20) = .57, p = .005), as well as a significant increase in the percentage of diagrams that only had labels for geometric objects that are not points (r (20) = .46, p = .02). This suggests that labeled points played a lesser role as resources that realize identifying relational processes in diagrams in later 20th century geometry textbooks. It is also the case that textbooks that had higher percentages of diagrams with no points labeled had lower percentages of diagrams with all points labeled (r (20) = -.84, p .001). Finally, textbooks that had higher percentages of diagrams with only other labels had higher percentages of diagrams with no points labeled (r (20) = .83, p
 .001) and lower percentages of diagrams with all points labeled (r (20) = -.72, p
 .001). These correlations provide further evidence that in early 20th century geometry textbooks, labeled points were the primary resources for identifying the geometric objects represented in a diagram, but in later 20th century textbooks, other labeling resources were increasingly common.
One possible reason for the gradual move away from points as the principal resources that realize identifying processes is to streamline references to the objects in a diagram. This rationale was articulated by Baker (1902) as one motivation for his system of automatic diagrams: “Under the current system, the student is bewildered by the wilderness of letters . . . his energies are taxed . . . in trying to disentangle the mass of letters and in finding what concept they are intended to symbolize” (p. 486). Baker went on to describe this method of identifying geometric objects as the “needle-in-the-haystack” (p. 486) method of communicating with diagrams. He argued that, “if the concept could be symbolized by a single letter instead of by three, the labor of perception with its accompanying recognitions and judgments would be greatly reduced” (p. 486).
Along these lines, researchers have more recently argued that using three letters to identify an angle introduces the possibility of a conflict between verbal and pictorial representations—that is, applying top-down, left-right conventions for reading to the task of naming angles (Gal & Linchevski, 2010). In instances where an angle is oriented so that its vertex is visually displayed to the left or higher than the endpoints of the angle, students may identify the angle by stating the vertex before (rather than in between) the endpoints, thus violating the normative mathematical practice (see Gal & Linchevski, 2010). The use of numerals to label angles provides a direct, unambiguous method of identifying angles. Dedicated labels for lines, segments, or arcs similarly provide standalone resources for referencing specific parts of a diagram. Such a reduction in referential complexity has an analog in the evolution of programming languages in which more structured, object-oriented languages have replaced more basic languages.
How markings are used in diagrams in geometry textbooks. Over the course of the 20th century, the increased use of labeling resources in geometry diagrams is matched by an increase in the use of markings that indicate the geometric relations of congruence, parallelism, and perpendicularity. We aggregated the inventory codes for markings to track how the prevalence of marked, unmarked, or diagrammatically marked attributes varied as date of publication changed. Figure 22 shows the percentages of diagrams per textbook that have at least one unmarked property, at least one marked, and at least one diagrammatically marked property as a function of the year in which a textbook was published.
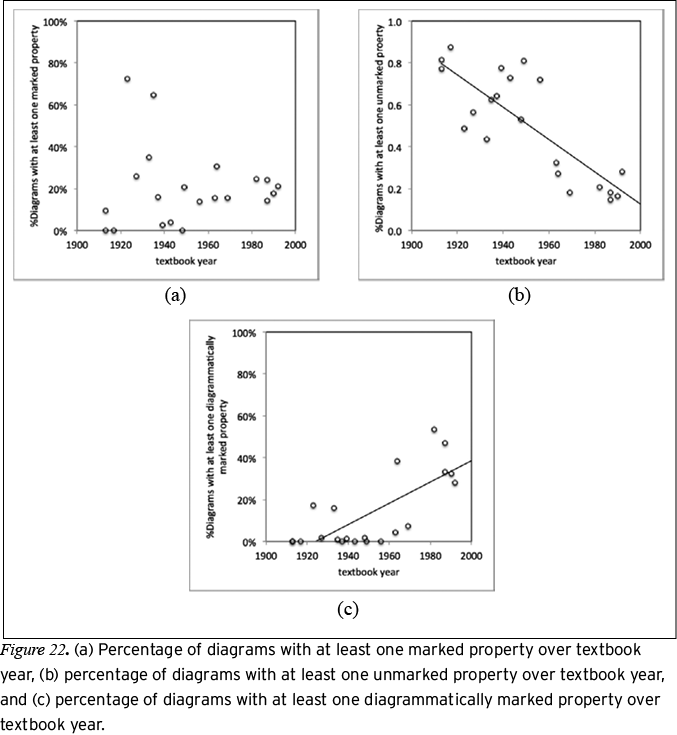
As date of publication increased, there was a significant decrease in the percentage of diagrams that have unmarked properties (r (20) = -.84, p .001) and a significant increase in the percentage of diagrams that have diagrammatically marked properties (r (20) = .77, p
 .001). Furthermore, as the percentage of diagrams with diagrammatically marked properties in a textbook increased, the percentage of diagrams with unmarked properties decreased (r (20) = -.82, p
 .001). These trends suggest that later 20th-century textbooks have more diagrams that convey geometric properties directly—and in the case of diagrammatically marked properties, only—through choices in the Attributes system. That is, as date of textbook publication increased, the potential for diagrams to directly realize classifying relational processes increased.
From the inventory codes for markings, we defined three classes of diagrams that further describe the trends in the use of markings in diagrams: diagrams that only have unmarked properties, diagrams that only have marked properties, and diagrams that only have diagrammatically marked properties. Diagrams with only unmarked properties require the text to convey congruence, perpendicularity, and parallelism relations; diagrams with only marked properties convey congruence, perpendicularity, and parallelism relations through both geometric diacriticals and statements that accompany the diagrams; and diagrams with only diacritically marked properties convey congruence, perpendicularity, and parallelism relations solely through geometric diacriticals (no accompanying text). Figure 23 shows scatter plots of percentages of diagrams in a textbook in each of these classes against year of publication.
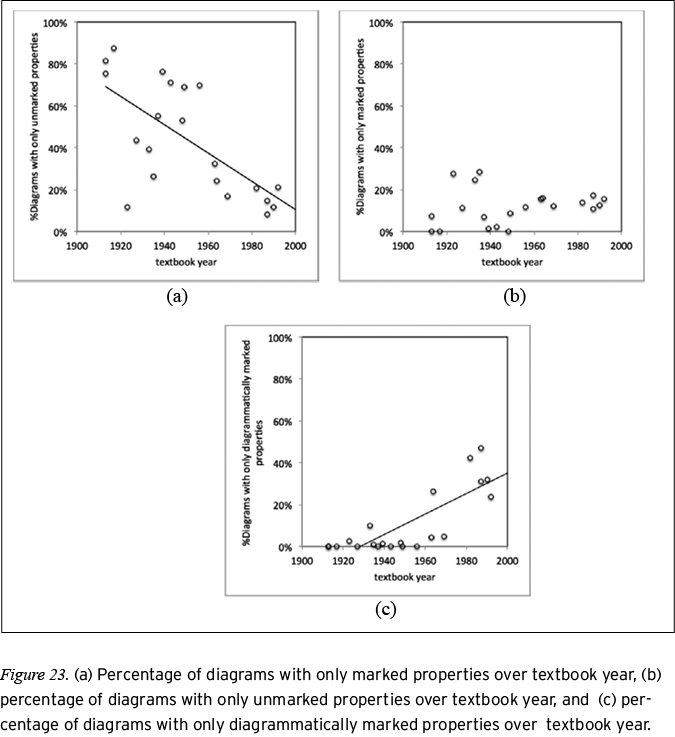
Although there is no correlation between percentage of diagrams that only have marked properties and textbook year, there is a significant negative correlation between publication year and percentage of diagrams that only have unmarked properties (r (20) = -.70, p .001) and a significant positive correlation between publication year and percentage of diagrams that only have diagrammatically marked properties (r (20) = .82, p
 .001). Furthermore, textbooks with higher percentages of diagrams with only unmarked properties had lower percentages of diagrams with only marked properties (r (20) = -.72, p
 .001) and lower percentages of diagrams with only diagrammatically marked properties (r (20) = -.69, p
 .001).
These trends suggest that later 20th-century geometry textbooks had more diagrams that only convey geometric properties through the use of different markings in the Attributes system. Diagrams that use markings to visually realize classifying relational processes encode more information than diagrams in which geometric relationships are specified by textual statements that accompany the figure. Investigating how this additional information affects the readability of a diagram as a visual text is a subject for further research. For now, we observe that the method we developed for inventorying the use of markings in a diagram provides a basis for measuring different kinds of semiotic work that diagrams can do in geometry.
Several textbooks in the corpus shared at least one author (for more information, see Table 2). This overlap in authors introduces the possibility that what we observed to be historical changes in the use of semiotic systems were really just author preferences that coincided with when the textbooks were published. We tested the claim that author preferences were biasing our results by eliminating author duplicates and recalculating the correlation coefficients.11 Whether this reduction is achieved by keeping the earliest or latest textbook that an author wrote, the trends we reported in the previous section remain in the reported directions, though in three cases they are not significant.12
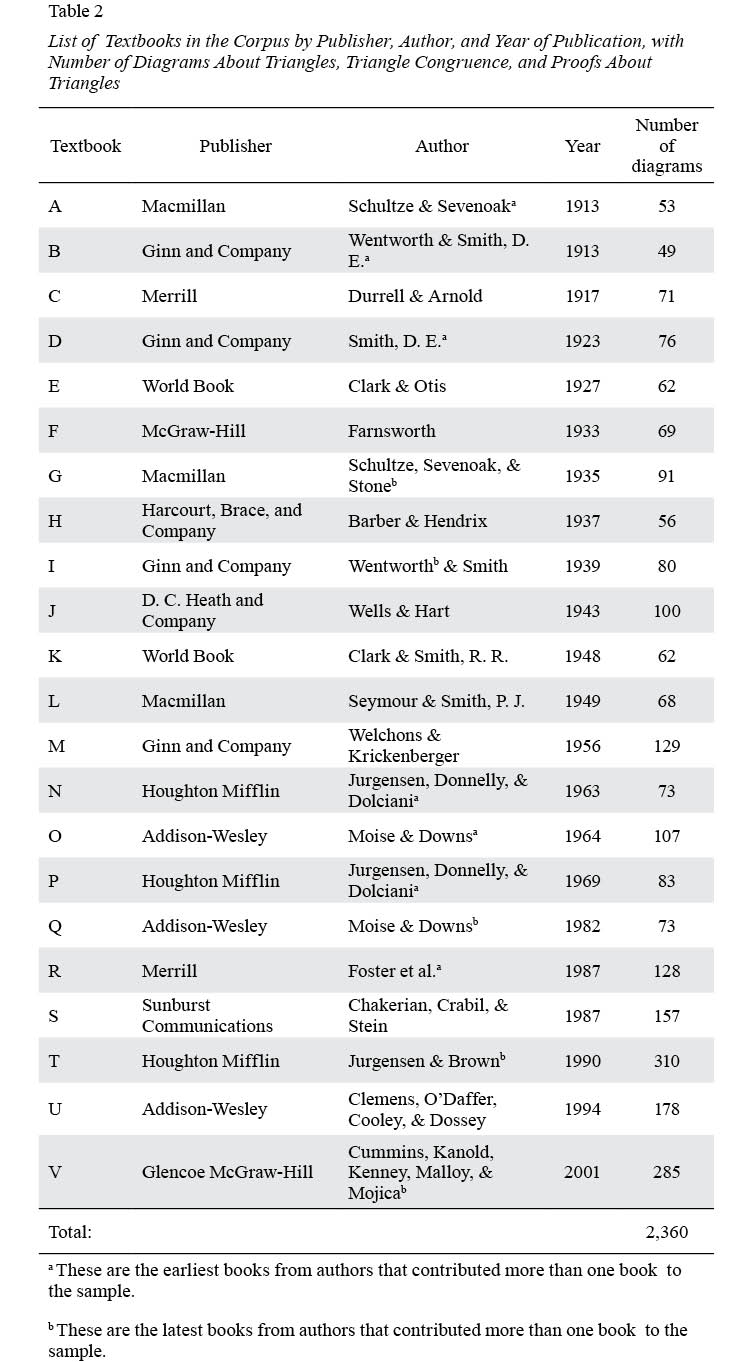
Discussion
We have developed a semiotic framework for describing geometry diagrams as visual texts and have shown how that framework could be used to study diagrams empirically. The analysis of 20th-century geometry textbooks reported in the second part of the study provides evidence for the claim that the visual literacy demands for reading diagrams that appear in geometry textbooks have increased during the 20th century. The claim itself is not surprising and is, in fact, consistent with coarser-grained arguments made by Kress and van Leeuwen (2006). That we were able to provide evidence to support this claim by undertaking a semiotic inventory of actual geometry diagrams underscores the potential for using this framework for other investigations of geometry diagrams. We consider some of these possibilities below, but first, we historically situate our findings about the semiotic systems of geometry diagrams.
Before 1910, there were scant instances of geometry textbooks that featured diagrams that used different weights or colors for strokes or that marked properties using geometric diacriticals (Manders, 2008). Although it was technically possible to produce visually rich diagrams before the 20th century, this was not the norm during that time. One notable exception was Byrne’s Euclid (Byrne, 1847), which used color and geometric diacriticals to visually mark the properties of geometry diagrams. However, Cajori (1993) remarked that Byrne’s use of symbols and colored diagrams “was not taken seriously, but was regarded as a curiosity” (p. 429).
Through the 1910s, it was still uncommon for geometry textbooks to use anything other than dotted lines to visually differentiate the parts of a diagram. For example, none of the 127 diagrams that appear in Book 1 of Wentworth and Smith’s (1913) Plane Geometry apply different colors or weights to strokes, use labels other than capital letters, or show special markings to convey theoretical properties. Some early 20th-century textbooks—such as Schultze and Sevenoak’s (1913) Plane and Solid Geometry and David Eugene Smith’s (1923) Essentials of Plane Geometry—featured diagrams that showed some visual variations, but neither the use of geometric diacriticals nor conventions for varying the weight and style of different parts had been standardized at that time.
The novel status of the visual features of these textbooks is evident in the absence of any mention of such features in Cajori’s (1993) A History of Mathematical Notations. Although Cajori dedicated an entire chapter to the development of the notations used in geometry, he did not address the history of any of the specialized symbolic markings that are used in geometry diagrams (such as using hash marks to indicate when two segments are congruent). Both the program for automatic diagrams laid out by Baker in 1902 and the omission of the history of diagrammatic notations from Cajori’s account suggest that these visual symbols emerged during the 20th century. Such historical evidence concurs with an observation by Manders (2008) about the use of hash marks to indicate congruence: “This practice seems too effective to have been readily lost once established; [sic] and is thus presumably a recent innovation” (p. 97).
By the end of the 20th century, the norm in textbooks was to include geometry diagrams that are rich in their use of different semiotic resources. The corpus study reported above described trends in the use of these resources for diagrams appearing in textbook sections about triangles, triangle congruence, and proofs about triangles, but the trend toward more visually varied and diverse semiotic resources is evident in other types of diagrams as well. Table 3 shows a comparison of some of the visual features of the diagrams in Book 1 of Wentworth and Smith’s (1913) Plane Geometry to some of the visual features of the diagrams from sections that are equivalent in Clemens, O’Daffer, Cooley, and Dossey’s (1994) Geometry. Table 3 shows the range of variation in the visual presentation of diagrams between a mainstream textbook in the early 20th century and a mainstream textbook in the later 20th century. An area for further study would be to examine how choices in the Prominence and Attributes systems in geometry textbooks vary according to subject. For instance, marked points in Clemens et al.’s (1994) Geometry are not prevalent in diagrams about triangles (18 of 178), but appear frequently in diagrams about points, lines, planes, and angles (34 of 51). This is consistent with the claim made in the first section of the article that variations in gauge are the visual means through which points are given more or less salience in the visual display.
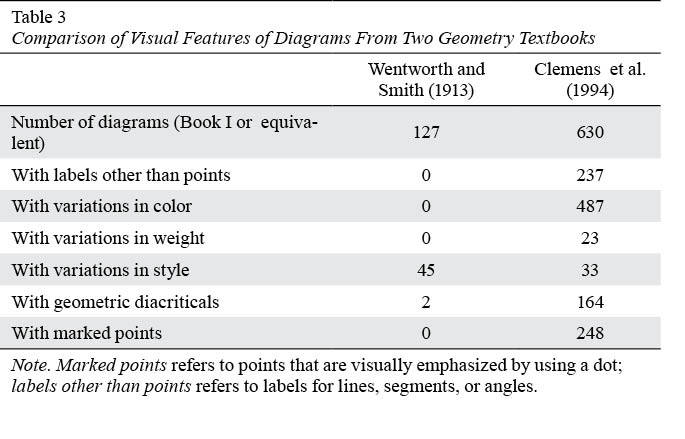
The finding that later 20th-century geometry textbooks have more visually varied diagrams than earlier 20th-century geometry textbooks is consistent with historical analyses of textbooks in other disciplines (e.g., LaSpina, 1998; Lee, 2010; Woodward, 1993). Throughout the 20th century, steady advances in printing technology “contributed to radically altering the form and content of the textbook, such that by the 1980s four-color reproduction print formats were the norm” (LaSpina, 1998, p. 59). As the costs of printing decreased throughout the 20th century, adding photo-realistic images to “almost every page” of a textbook (Woodward, 1993, p. 118)—even in technical disciplines like science (Lee, 2010)—became a standard means through which publishers enhanced the attractiveness of their products in an effort to boost sales (Woodward, 1993).
Though mathematics textbooks are not immune to the technical and market forces that have contributed to the steady increase in colorful visual representations, our semiotic analysis of the different visual resources through which diagrammatic texts represent meaning complicates this standard narrative. In the case of geometry textbooks, the application of colors, markings, and specialized labels to geometry diagrams—features that become easier to include as printing technology advances—is systematic and linked to conveying particular kinds of meaning. This is not necessarily the case in other subjects, where colorful illustrations may actually be less instructionally effective than the black-and-white illustrations they replaced (Woodward, 1993).
When used systematically and strategically, visual differences in geometry diagrams have the potential to help students more clearly see the essential relationships among the geometric figures they represent (Gal & Linchevski, 2010). If the communication potential of such visual differences is to be realized, students need to know how to read geometry diagrams. The systemic framework we developed and empirically validated provides theoretical footings that could help geometry teachers unpack their own practices for creating effective diagrams into teachable skills.
The semiotic framework we devised for conceptualizing geometry diagrams as visual texts could also provide analytic tools for investigating student interactions with dynamic geometry environments. An environment like GeoGebra (Hohenwarter & Preiner, 2007), for example, provides more choices under the Type system than those represented in network presented in Figure 5. In this environment, there are five initial choices for stroke. Each of these initial choices is represented by an icon and organized by geometric property. Under an icon that might be called generic straight stroke, there are seven subchoices, ranging from a line between two points to a vector from a point, with choices like segment, ray and poly line in between. Under an icon that might be called strokes that relate two or more objects, there are eight subchoices, ranging from perpendicular line to locus, with choices like parallel line,angle bisector, and tangents in between.
Beyond the Type system, the GeoGebra environment also provides resources for realizing choices in the Attributes and Prominence systems by clicking on an object and selecting the object properties dialog. The choices available in this dialog allow the user to vary, for example, the weight, style, and color of a stroke; the gauge, color, and fill of a point; and also what GeoGebra identifies as the decoration of objects like segments and angles. The choices, such as tuples of arrows on segments, available under the decoration heading overlap with the choices in the Attributes system described previously. Describing the systemic organization of the visual resources that are available in an environment like GeoGebra could help students learn to strategically use those resources to create clear, effective diagrammatic texts.
Conclusion
This article reports a semiotic catalog for geometry diagrams and shows how that catalog can be used to empirically study the variations in the diagrams of geometry textbooks. From the corpus study of the use of the Attributes and Prominence systems in diagrams about triangles, it is clear that diagrams in newer geometry textbooks make more extensive use of the systems in the semiotic catalog than those in older textbooks. This tendency for newer diagrams to have more and varied semiotic resources than older diagrams has implications for the role of visual—and more specifically, diagrammatic—literacy in geometry instruction.
An important issue in geometry instruction is to develop in students the capacity not only to interpret but also to create texts. Dynamic geometry software provides a range of options for customizing the visual appearance of the parts of diagrams. As it becomes standard to use dynamic geometry software and other digital means of representation in mathematics classrooms, it becomes all the more important that students develop a sensibility for crafting and reading diagrams and other visuals. Showing students visually rich representations does not guarantee that students will recognize the systematic ways visual differences are meaningful (Diezmann & English, 2001; González & Herbst, 2013; Yore, Pimm, & Tuan, 2007). For the full potential of these resources to be realized, there needs to be an effort toward teaching diagrammatic literacy skills.
Using systemic functional linguistics as a basis for demystifying language has been shown to be an effective strategy for teaching English language learners (Schleppegrell, 2013). The systems within the semiotic catalog presented here provide a basis for developing an analogous approach to teaching visual literacy in geometry. Teachers could use the choices in the Type, Position, Prominence, and Attributes systems to help students learn to see the visual differences in geometry diagrams as purposeful and to help students recognize how diagrams cohere as texts.
1 We do not include this synopsis of the common view of visual representations to endorse this view ourselves or to suggest that this view is endorsed by mathematicians, but only to underscore that the status of visual representations in mathematical arguments has been fraught throughout the 20th century.
2 The hypotenuse, is congruent to itself,  with
with  congruent to
 by virtue of being radii of the same circle.
3 Throughout this article, we refer to these as “20th-century textbooks.”
4 Our consideration of traffic signals and traffic lanes is inspired by the classic semiotic example of the three-colored traffic light (see Eggins, 2004).
5 This visual independence refers to how a dot in a diagram appears and does not necessarily align with the geometric freedom (in the sense of Netz, 1998) of the point that a dot represents.
6 We note that, throughout the 20th century, different textbooks have used different conventions for diacritical markings. For example, Smith (1923) used sets of hash marks on single arcs, rather than sets of arcs, to indicate congruent angles. We do not undertake an analysis of the differences in marking systems across textbooks for this study but raise this as a possibility for future research.
7 The distinctions we have made between kinds of properties describe a particular state of affairs in the way of drawing diagrams in American geometry textbooks. One could imagine other possibilities for drawing diagrams that would not lead to these distinctions, and in fact there are formal diagrammatic geometries in which, for instance, all geometric properties are conveyed diagrammatically. See Miller (2001, 2007) for an example.
8 These textbooks were a randomly sampled subset of the 22 textbooks in the corpus (see Table 3).
9 See the Appendix for examples of coded diagrams.
10 We also inventoried for the use of shade; however, the percentage of diagrams displaying shading in each book was less than .025.
11 We acknowledge an anonymous reviewer who raised the possibility of confounding author effects and suggested this method of recalculating the correlations. Table 2 identifies the early and late textbook subsets.
12 Prominence, labels, and markings correlations (with year of publication) for the early (n = 16) and late (n = 15) subsets, respectively: %with color (r = .69, p = .003; r = .717, p = .003), %with style (r = -.71, p = 002; r = -.811, p < .001); %with labeled point (r = -.46, p = .07; r = -.623, p = .013), %with only unlabeled points (r =.497, p = .050; r = .62, p = .014), %with only other labels (r = .444, p = .085; r = .63, p = .012); %with unmarked properties (r = -.781, p < .001; r = -.843, p < .001), %with diagrammatically marked properties (r = .708, p = .002; r = .845, p < .001), %with only unmarked properties (r = -.657, p = .006; r = -.746, p = .001), %with only diagrammatically marked properties (r = .78, p < .001; r = . 883, p <.001).
References
Alshwaikh, J. (2010). Geometrical diagrams as representation and communication: A functional analytic framework. Research in Mathematics Education, 12(1), 69–70. doi: 10.1080/14794800903569881
Alshwaikh, J. (2011). Geometrical diagrams as representation and communication: A functional analytic framework (Unpublished doctoral thesis). Institute of Education, University of London, London, United Kingdom.
Arcavi, A. (2003). The role of visual representations in the learning of mathematics. Educational Studies in Mathematics, 52(3), 215–241. doi:10.1023/A:1024312321077
Attneave, F. (1968). Triangles as ambiguous figures. American Journal of Psychology, 81(3), 447–453. doi:10.2307/1420645
Baker, A. L. (1902). Automatic diagrams in geometry. The School Review, 10(6), 486–496. doi:10.1086/434353
Baker, D., Knipe, H., Collins, J., Leon, J., Cummings, E., Blair, C., & Gamson, D. (2010). One hundred years of elementary school mathematics in the United States: A content analysis and cognitive assessment of textbooks from 1900 to 2000. Journal for Research in Mathematics Education, 41(4), 383–423.
Barber, H. C., & Hendrix, G. (1937). Plane geometry & Its reasoning. B. H. Brown (Ed.). New York, NY: Harcourt, Brace, and Company.
Barwise, J., & Etchemendy, J. (1996). Visual information and valid reasoning. In G. Allwein & J. Barwise (Eds.), Logical reasoning with diagrams (pp. 3–25). New York, NY: Oxford University Press.
Butcher, K. R. (2006). Learning from text with diagrams: Promoting mental model development and inference generation. Journal of Educational Psychology, 98(1), 182–197. doi:10.1037/0022-0663.98.1.182
Byrne, O. (1847). Byrne’s Euclid: The first six books of the Elements of Euclid in which coloured diagrams and symbols are used instead of letters for the greater ease of learners. London, England: William Pickering.
Cajori, F. (1993). A history of mathematical notations (Vol. 1). Mineola, NY: Dover Publications.
Chakerian, G. D., Crabil, C. D., & Stein, S. K. (1987). Geometry: A guided inquiry. Pleasantville, NY: Sunburst Communications.
Chotimongkol, A., & Rudnicky, A. I. (2001). N-best speech hypotheses reordering using linear regression (Computer Science Department, Paper 1400). Retrieved from Carnegie Mellon University, Computer Science Department http://repository.cmu.edu/compsci/1400
Christou, C., Mousoulides, N., Pittalis, M., & Pitta-Pantazi, D. (2004). Proofs through exploration in dynamic geometry environments. International Journal of Science and Mathematics Education, 2(3), 339–352. doi:10.1007/s10763-004-6785-1
Cicchetti, D. V., & Feinstein, A. R. (1990). High agreement but low kappa: II. Resolving the paradoxes. Journal of Clinical Epidemiology, 43(6), 551–558. doi:10.1016/0895-4356(90)90159-M
Clark, J. R., & Otis, A. S. (1927). Modern plane geometry. Yonkers-on-Hudson, NY: World Book Company.
Clark, J. R., & Smith, R. R. (1948). Modern school geometry. Yonkers-on-Hudson, NY: World Book Company.
Clemens, S. R., O’Daffer, P. G., Cooley, P. J., & Dossey, J. A. (1994). Addison-Wesley geometry. Menlo Park, CA: Addison-Wesley.
Clements, D. H., & Battista, M. T. (1989). Learning of geometric concepts in a Logo environment. Journal for Research in Mathematics Education, 20(5), 450–467. doi:10.2307/749420
Clements, D. H., & Battista, M. T. (1992). Geometry and spatial reasoning. In D. A. Grouws (Ed.), Handbook of research on mathematics teaching and learning (pp. 420–464). New York, NY: Macmillan.
Clements, D. H., & Battista, M. T. (with Sarama, J.). (2001). Logo and geometry. Journal for Research in Mathematics Education monograph series, 10. Reston, VA: National Council of Teachers of Mathematics.
Cummins, J., Kanold, T., Kenney, M., Malloy, C., & Mojica, Y. (2001). Geometry: Concepts and applications. New York, NY: Glencoe McGraw-Hill.
Davis, P. J. (2006). Mathematics and common sense: A case of creative tension. Natick, MA: A K Peters. doi:10.1201/b10575
Diezmann, C. M., & English, L. D. (2001). Promoting the use of diagrams as tools for thinking. In A. A. Cuoco & F. R. Curcio (Eds.), The roles of representation in school mathematics: 2001 yearbook (pp. 77–89). Reston, VA: National Council of Teachers of Mathematics.
Donoghue, E. F. (2003). Algebra and geometry textbooks in twentieth-century America. In G. M. A. Stanic & J. Kilpatrick (Eds.), A history of school mathematics (Vol. 1, pp. 329–398). Reston, VA: National Council of Teachers of Mathematics.
Driver, J., Baylis, G. C., Goodrich, S. J., & Rafal, R. D. (1994). Axis-based neglect of visual shapes. Neuropsychologia, 32(11), 1353–1356. doi:10.1016/0028-3932(94)00068-9
Durrell, F., & Arnold, E. E. (1917). Plane geometry. New York, NY: Charles E. Merrill.
Duval, R. (1995). Geometrical pictures: Kinds of representation and specific processings. In R. Sutherland & J. Mason (Eds.), Exploiting mental imagery with computers in mathematics education (pp. 142–157). Berlin, Germany: Springer-Verlag. doi:10.1007/978-3-642-57771-0_10
Duval, R. (2006). A cognitive analysis of problems of comprehension in a learning of mathematics. Educational Studies in Mathematics, 61(1–2), 103–131. doi:10.1007/s10649-006-0400-z
Eggins, S. (2004). An introduction to systemic functional linguistics (2nd ed.). London, England: Continuum International Publishing Group.
Eisenberg, T. (1991). Functions and associated learning difficulties. In D. Tall (Ed.), Advanced mathematical thinking (pp. 140–152). Dordrecht, the Netherlands: Springer. doi:10.1007/0-306-47203-1_9
Farnsworth, R. D. (1933). Plane geometry. New York, NY: McGraw-Hill.
Fischbein, E. (1993). The theory of figural concepts. Educational Studies in Mathematics, 24(2), 139–162. doi:10.1007/BF01273689
Foster, A. G., Cummins, J. J., & Yunker, L. E. (1987). Merrill geometry. Columbus, OH: Merrill.
Fujita, T., & Jones, K. (2003). The place of experimental tasks in geometry teaching: Learning from the textbook designs of the early 20th century. Research in Mathematics Education, 5(1), 47–62. doi:10.1080/14794800008520114
Gal, H., & Linchevski, L. (2010). To see or not to see: Analyzing difficulties in geometry from the perspective of visual perception. Educational Studies in Mathematics, 74(2), 163–183. doi:10.1007/s10649-010-9232-y
Giaquinto, M. (1992). Visualizing as a means of geometrical discovery. Mind and Language, 7(4), 381–401. doi:10.1111/j.1468-0017.1992.tb00311.x
González, G., & DeJarnette, A. F. (2012). Agency in a geometry review lesson: A linguistic view on teacher and student division of labor. Linguistics and Education, 23(2), 182–199. doi:10.1016/j.linged.2012.02.001
González, G., & Herbst, P. (2013). An oral proof in a geometry class: How linguistic tools can help map the content of a proof. Cognition and Instruction, 31(3), 271–313. doi:10.1080/07370008.2013.799166
Grattan-Guinness, I. (1998). The Norton history of the mathematical sciences: The rainbow of mathematics. New York, NY: WW Norton & Company Incorporated.
Greaves, M. (2002). The philosophical status of diagrams. Stanford, CA: Center for the Study of Language and Information.
Gries, S. T. (2010). Useful statistics for corpus linguistics. In A. Sánchez & M. Almela (Eds.), A mosaic of corpus linguistics: Selected approaches (Vol. 66, pp. 269–291). Frankfurt, Germany: Peter Lang.
Halliday, M. A. K. (1973). Explorations in the functions of language. London, England: Edward Arnold.
Halliday, M. A. K., & Matthiessen, C. M. I .M. (2004). An introduction to functional grammar (3rd ed.). London, England: Hodder Arnold.
Henderson, A. (1920). The teaching of geometry. University of North Carolina Record: Extension Series, Issue 39. Chapel Hill, NC: University of North Carolina.
Herbel-Eisenmann, B. A., & Otten, S. (2011). Mapping mathematics in classroom discourse. Journal for Research in Mathematics Education, 42(5), 451–485. doi:10.5951/jresematheduc.42.5.0451
Herbst, P. G. (2002). Establishing a custom of proving in American school geometry: Evolution of the two-column proof in the early twentieth century. Educational Studies in Mathematics, 49(3), 283–312. doi:10.1023/A:1020264906740
Herbst, P. (2004). Interactions with diagrams and the making of reasoned conjectures in geometry. ZDM: The International Journal on Mathematics Education, 36(5), 129–139. doi:10.1007/BF02655665
Herbst, P., & Kosko, K. W. (2014). Using representations of practice to elicit mathematics teachers’ tacit knowledge of practice: A comparison of responses to animations and videos. Journal of Mathematics Teacher Education, 17(6), 515–537. doi:10.1007/s10857-013-9267-y
Herbst, P., Kosko, K. W., & Dimmel, J. K. (2013). How are geometric proof problems presented? Conceptualizing and measuring teachers’ recognition of the diagrammatic register. In M. V. Martinez & A. C. Superfine (Eds.), Proceedings of the 35th Annual Meeting of the North American Chapter of the International Group for the Psychology of Mathematics Education (pp. 179–186). Chicago, IL: University of Illinois at Chicago.
Hilbert, D. (1999). Foundations of geometry. Peru, IL: Open Court.
Hohenwarter, M., & Preiner, J. (2007). Dynamic mathematics with GeoGebra. Journal for Online Mathematics and Its Applications, 7. Retrieved from http://www.maa.org/external_archive/joma/Volume7/Hohenwarter/index.html
Hsu, H.-Y. (2010). The study of Taiwanese students’ experiences with geometric calculation with number (GCN) and their performance on GCN and geometric proof (GP ) (Doctoral dissertation). Retrieved from ProQuest Dissertations and Theses database. (UMI No. 3441210)
Hsu, H.-Y., & Silver, E. A. (2014). Cognitive complexity of mathematics instructional tasks in a Taiwanese classroom: An examination of task sources. Journal for Research in Mathematics Education, 45(4), 460–496. doi:10.5951/jresematheduc.45.4.0460
Inglis, M., & Mejía-Ramos, J. P. (2009). On the persuasiveness of visual arguments in mathematics. Foundations of Science, 14(1–2), 97–110. doi:10.1007/s10699-008-9149-4
Jewitt, C., & Kress, G. (Eds.). (2003). Multimodal literacy. New York, NY: Peter Lang.
Jurgensen, R. C., & Brown, R. G. (1990). Basic geometry. Boston, MA: Houghton Mifflin.
Jurgensen, R. C., Donnelly, A. J., & Dolciani, M. P. (1963). Modern geometry: Structure and method. Boston, MA: Houghton Mifflin.
Jurgensen, R. C., Donnelly, A. J., & Dolciani, M. P. (1969) Modern school mathematics: Geometry. Boston, MA: Houghton Mifflin.
Koedinger, K. R., & Anderson, J. R. (1990). Abstract planning and perceptual chunks: Elements of expertise in geometry. Cognitive Science, 14(4), 511–550. doi:10.1207/s15516709cog1404_2
Kosko, K. W., & Herbst, P. (2012). A deeper look at how teachers say what they say: A quantitative modality analysis of teacher-to-teacher talk. Teaching and Teacher Education, 28(4), 589–598. doi:10.1016/j.tate.2011.11.010
Kress, G. (2010). Multimodality: A social semiotic approach to contemporary communication. London, England: Routledge.
Kress, G., & van Leeuwen, T. (2006). Reading images: The grammar of visual design (2nd ed.). London, England: Routledge.
Laborde, C. (2005). The hidden role of diagrams in students’ construction of meaning in geometry. In J. Kilpatrick, C. Hoyles, & O. Skovsmose (with P. Valero) (Eds.), Meaning in mathematics education (pp. 159–179). New York, NY: Springer. doi:10.1007/0-387-24040-3_11
Lam, M., & Webster, J. (2009). The lexicogrammatical reflection of interpersonal relationship in conversation. Discourse Studies, 11(1), 37–57. doi:10.1177/1461445608098497
Lampert, M. (1993). Teachers’ thinking about students’ thinking about geometry: The effects of new teaching tools. In J. L. Schwartz, M. Yerushalmy, & B. Wilson (Eds.), The geometric supposer: What is it a case of? (pp. 143–177). Hillsdale, NJ: Lawrence Erlbaum.
Larkin, J. H., & Simon, H. A. (1987). Why a diagram is (sometimes) worth ten thousand words. Cognitive Science, 11(1), 65–100. doi:10.1111/j.1551-6708.1987.tb00863.x
LaSpina, J. A. (1998). The visual turn and the transformation of the textbook. Mahwah, NJ: Lawrence Erlbaum.
Lee, V. R. (2010). Adaptations and continuities in the use and design of visual representations in US middle school science textbooks. International Journal of Science Education, 32(8), 1099–1126. doi:10.1080/09500690903253916
Lemke, J. L. (1990). Talking science: Language, learning, and values. Norwood, NJ: Ablex.
Lemke, J. L. (2003). Mathematics in the middle: Measure, picture, gesture, sign, and word. In M. Anderson, A. Sáenz-Ludlow, S. Zellweger, & V. V. Cifarelli (Eds.), Educational perspectives on mathematics as semiosis: From thinking to interpreting to knowing (pp. 215–234). Ottawa, Ontario, Canada: Legas Publishing.
Lin, F.-L. (2005). Modelling students’ learning on mathematical proof and refutation. In H. L. Chick & J. L. Vincent (Eds.), Proceedings of the 29th International Conference for the Psychology of Mathematics Education (Vol. 1, pp. 3–18). Melbourne, Australia.
Manders, K. (2008). The Euclidean diagram. In P. Mancosu (Ed.), The philosophy of mathematical practice (pp. 112–183). Oxford, England: Oxford University Press.
Mesa, V. (2004). Characterizing practices associated with functions in middle school textbooks: An empirical approach. Educational Studies in Mathematics, 56(2–3), 255–286. doi:10.1023/B:EDUC.0000040409.63571.56
Mesa, V., & Chang, P. (2010). The language of engagement in two highly interactive undergraduate mathematics classrooms. Linguistics and Education, 21(2), 83–100. doi:10.1016/j.linged.2010.01.002
Miller, N. G. (2001). A diagrammatic formal system for Euclidean geometry (Doctoral dissertation). Retrieved from ProQuest Dissertations and Theses database. (UMI No. 3011210)
Miller, N. (2007). Euclid and his twentieth century rivals: Diagrams in the logic of Euclidean geometry. Stanford, CA: Center for the Study of Language and Information.
Moise, E. E., & Downs, F. L. (1964). Geometry. Reading, MA: Addison-Wesley.
Moise, E. E., & Downs, F. L. (1982). Geometry (Rev. ed.). Menlo Park, CA: Addison-Wesley.
Moore-Russo, D., Viglietti, J. M., Chiu, M. M., & Bateman, S. M. (2013). Teachers’ spatial literacy as visualization, reasoning, and communication. Teaching and Teacher Education, 29, 97–109.
doi:10.1016/j.tate.2012.08.012
Morgan, C. (2011). Making sense of curriculum innovation and mathematics teacher identity. In C. Kanes (Ed.), Elaborating professionalism: Studies in practice and theory (pp. 107–122). Dordrecht, the Netherlands: Springer. doi:10.1007/978-90-481-2605-7_6
Muñoz, S. R., & Bangdiwala, S. I. (1997). Interpretation of kappa and B statistics measures of agreement. Journal of Applied Statistics, 24(1), 105–112. doi:10.1080/02664769723918
Netz, R. (1998). Greek mathematical diagrams: Their use and their meaning. For the Learning of Mathematics, 18(3), 33–39.
O’Halloran, K. L. (2005). Mathematical discourse: Language, symbolism, and visual images. London, United Kingdom: Continuum.
O’Halloran, K. L. (2008). Inter-semiotic expansion of experiential meaning: Hierarchical scales and metaphor in mathematics discourse. In E. Ventola & C. Jones (Eds.), New developments in the study of ideational meaning: From language to multimodality (pp. 231–254). London, England: Equinox.
O’Toole, M. (2011). The language of displayed art (2nd ed.). London, England: Routledge.
Pagel, M., Atkinson, Q. D., & Meade, A. (2007). Frequency of word-use predicts rates of lexical evolution throughout Indo-European history. Nature, 449(7163), 717–720. doi:10.1038/nature06176
Palmer, S. E. (1980). What makes triangles point: Local and global effects in configurations of ambiguous triangles. Cognitive Psychology, 12(3), 285–305. doi:10.1016/0010-0285(80)90012-2
Parzysz, B. (1988). “Knowing” vs “seeing.” Problems of the plane representation of space geometry figures. Educational Studies in Mathematics, 19(1), 79–92. doi:10.1007/BF00428386
Pimm, D. (1987). Speaking mathematically: Communication in mathematics classrooms. London, England: Routledge and Kegan Paul.
Rock, I. (1973). Orientation and form. New York, NY: Academic Press.
Schleppegrell, M. J. (2007). The linguistic challenges of mathematics teaching and learning: A research review. Reading & Writing Quarterly, 23(2), 139–159. doi:10.1080/10573560601158461
Schleppegrell, M. J. (2010). Language in mathematics teaching and learning. In J. N. Moschkovich (Ed.), Language and mathematics education: Multiple perspectives and directions for research (pp. 73–112). Charlotte, NC: Information Age Publishing.
Schleppegrell, M. J. (2013). The role of metalanguage in supporting academic language development. Language Learning, 63(s1), 153–170. doi:10.1111/j.1467-9922.2012.00742.x
Schultz, J. E., Ellis, W., Hollowell, K. A., Kennedy, P. A., & Holt, R. (2004). Geometry. Austin, TX: Holt, Rinehart and Winston.
Schultze, A., & Sevenoak, F. L. (1913). Plane geometry (Rev. ed.). New York, NY: Macmillan.
Schultze, A., Sevenoak, F. L., & Stone, L. L. C. (1935). Plane geometry. New York, NY: Macmillan.
Seymour, F. E., & Smith, P. J. (1949). Plane geometry. New York, NY: Macmillan.
Shreyar, S., Zolkower, B., & Pérez, S. (2010). Thinking aloud together: A teacher’s semiotic mediation of a whole-class conversation about percents. Educational Studies in Mathematics, 73(1), 21–53. doi:10.1007/s10649-009-9203-3
Smith, D. E. (1923). Essentials of plane geometry. Boston, MA: Ginn and Company.
Tang, K.-S. (2011). Reassembling curricular concepts: A multimodal approach to the study of curriculum and instruction. International Journal of Science and Mathematics Education, 9(1), 109–135. doi:10.1007/s10763-010-9222-7
Thompson, D. R., Senk, S. L., & Johnson, G. J. (2012). Opportunities to learn reasoning and proof in high school mathematics textbooks. Journal for Research in Mathematics Education, 43(3), 253–295. doi:10.5951/jresematheduc.43.3.0253
van Leeuwen, T. (1999). Speech, music, sound. London, England: Palgrave Macmillan.
van Leeuwen, T. (2005). Introducing social semiotics. London, England: Routledge.
van Leeuwen, T. (2009) Parametric systems: The case of voice quality. In C. Jewitt (Ed.), The Routledge handbook of multimodal analysis (pp. 68–77). Abingdon, Oxon, United Kingdom: Routledge.
Van Sickle, J. (2011). A history of trigonometry education in the United States: 1776–1900 (Doctoral dissertation). Retrieved from ProQuest Dissertations and Theses database. (Order No. 3453860)
von Engelhardt, J. (2002). The language of graphics: A framework for the analysis of syntax and meaning in maps, charts and diagrams (Doctoral thesis, Institute for Logic, Language and Computation, Universiteit van Amsterdam, Amsterdam, the Netherlands). Retrieved from http://dare.uva.nl/document/2/21566
Weiss, M., & Herbst, P. (2007, April). “Every single little proof they do, you could call it a theorem”: Translation between abstract concepts and concrete objects in the geometry classroom. Paper presented at the Annual Meeting of American Educational Research Association, Chicago, IL.
Welchons, A. M., & Krickenberger, W. R. (1956). New plane geometry. Boston, MA: Ginn and Company.
Wells, W., & Hart, W. W. (1915). Plane geometry. Boston, MA: D. C. Heath & Company.
Wells, W., & Hart, W. W. (1943). Progressive plane geometry (2nd ed.). Boston, MA: D. C. Heath and Company.
Wentworth, G. A., & Smith, D. E. (1913). Plane geometry (Rev. ed.). Boston, MA: Ginn and Company.
Wentworth, G. A., & Smith, D. E. (1939). Plane and solid geometry. Boston, MA: Ginn and Company.
Woodward, A. (1993). Do illustrations serve an instructional purpose in U.S. textbooks? In B. K. Britton, A. Woodward, & M. Binkley (Eds.), Learning from textbooks: Theory and practice (pp. 115–134). Hillsdale, NJ: Lawrence Earlbaum.
Yackel, E., & Cobb, P. (1996). Sociomathematical norms, argumentation, and autonomy in mathematics. Journal for Research in Mathematics Education, 27(4), 458–477. doi:10.2307/749877
Yore, L. D., Pimm, D., & Tuan, H.-L. (2007). The literacy component of mathematical and scientific literacy. International Journal of Science and Mathematics Education, 5(4), 559–589. doi:10.1007/s10763-007-9089-4
Zimmermann, W., & Cunningham, S. (Eds.). (1991). Visualization in teaching and learning mathematics (MAA Notes # 19). Washington, DC: Mathematical Association of America.
Zolkower, B., & de Freitas, E. (2012). Mathematical meaning-making in whole class conversation: Functional-grammatical analysis of a paradigmatic text. Language and Dialogue, 2(1), 60–79. doi:10.1075/ld.2.1.04zol
Zolkower, B., & Shreyar, S. (2007). A teacher’s mediation of a thinking-aloud discussion in a 6th grade mathematics classroom. Educational Studies in Mathematics, 65(2), 177–202. doi:10.1007/s10649-006-9046-0
Authors
Justin K. Dimmel, School of Education, University of Michigan, 610 E. University Avenue, Ann Arbor, MI 48109; [email protected]
Patricio G. Herbst, School of Education, University of Michigan, 610 E. University Avenue, Ann Arbor, MI 48109; [email protected]
Submitted March 23, 2014
Accepted July 3, 2014
APPENDIX
Examples of coded diagrams.
Example 1:
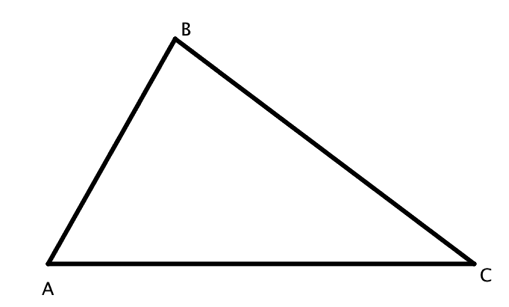
Diagram reproduced from Durrell and Arnold’s (1917) Plane Geometry (p. 30).
Diagram metadata: This diagram was indexed as Durrell_1917-30.2, to indicate that it is the second diagram (following the top–down, left–right protocol described previously) to appear on page 30 of Durrell and Arnold’s (1917) Plane Geometry. The diagram appears under the heading Triangles of the section labeled Book I.
Prominence codes: There are no variations in weight (line thickness), style (lines are all unbroken), color (everything is black), or gauge (points A, B, and C are not marked by dots) for any of the parts of the diagram. The diagram was therefore coded as (0,0,0,0) for each of these categories.
Attributes code: This diagram accompanies the following text:
The sides of a triangle are the lines which bound it. The perimeter of a triangle is the sum of the sides. The angles of a triangle are the angles formed by the sides; as the angles A, B, and C. The vertices of a triangle are the vertices of the angles of the triangle. (Durrell & Arnold, 1917, p. 30)
Markings: The accompanying text refers to the sides, angles, and vertices of a triangle but not to any relationships that have diagrammatic markings. Thus, this diagram was coded as (0,0,0) for each of the marked, unmarked, and diagrammatically marked properties (i.e., congruent angles, congruent segments, right angles, parallel lines) codes.
Labels: The vertices of the triangles are labeled, and there are no other points in the diagram. Thus, the diagram was coded as (1) for labeled points and (0) for unlabeled points. There are no other labels in the diagram, which means the diagram was coded as (0,0,0) for the labels on strokes, labels in regions, and other labels categories.
Example 2:
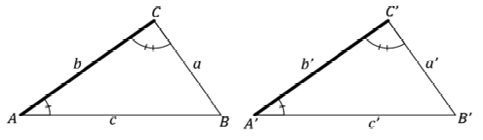
Diagram reproduced from Smith’s (1923) Essentials of Plane Geometry (p. 30).
Diagram metadata: This diagram was indexed as Smith_1923-30.1, to indicate that it is the first diagram to appear on page 30 of Smith’s (1923) Essentials of Plane Geometry. The diagram appears under the heading Fundamental Theorems of the section labeled Book I.
Prominence codes: This diagram shows variation in weight: Strokes AC and A C
C  are heavier than the other strokes. The diagram does not show any variations in style, color, or gauge. The diagram was coded as (1) for weight and (0) for all other prominence codes.
Attributes code: The diagram is accompanied by the following statement of what is given to be true about the figure:
Given the  s
s (Smith, 1923, p. 30)
Markings: The statement indicates that angles A and A , along with angles C and C
 , are congruent; these congruent angles are marked in the diagram (arcs with sets of hash marks). Thus, the diagram was coded as (1) for having marked angles. Because no additional angles are given as congruent and no additional angle markings are in the diagram, the diagram was coded as (0) for having unmarked and diagrammatically marked angles.
The statement also indicates that segment b is equal to segment b’ . Although these segments are visually emphasized through having heavier stroke weight, they are not marked as congruent in the diagram. Thus, the diagram was coded as (1) for having unmarked segments. None of the other segments were given as being congruent, and there are no other segments marked congruent in the diagram, thus the diagram was coded as (0) for having marked and diagrammatically marked segments. There are no parallel lines in the diagram, and there are also no right angles, so the diagram was coded as (0,0,0) for the marked, unmarked, and diagrammatically marked attributes codes for these properties.
Labels: The diagram has labels for each of the points of the triangles. There are no other visually distinct points in the diagram. Thus, the diagram was coded as (1) for labeled points and (0) for unlabeled points. The diagram also has dedicated labels for its segments. It was therefore coded as (1) for labels on strokes.