By Jordan Benedict, posted September 11, 2017 —
In part 1 of this blog series, we sent out a call to change the
way we look at data: from quick snapshot vignettes to longitudinal narratives
that dig deep into your students’ individual learning story. The call to action
requires a few key shifts in how we think about using data; we want to move—
• from summative data to
formative data;
• from monitoring episodic
achievement to witnessing the complexities of long-term learning; and
• from data for accountability
measures to data used to empower students and teachers.
To see this shift in action, let's
run through steps and an example together. It’s messy; it’s not perfect; and neither
are teaching and learning. Improving the process is what makes us all enjoy our
work.
Step 1: Ask, “What do I wish I knew?”
Educators all too often do work for
the sake of doing work; we feel compelled to fix something. Instead, replace that nagging question with those
that will influence learning. The question should always align with your vision
and values, be focused on students, and feel like the answer could be
inspiring.

Step 2: Ask, “How can we measure this?”
Developing measuring tools is one of
the trickiest steps, which is likely the reason we rely on large companies to
develop testing protocols that guarantee “valid” and “reliable” results. This
insecurity has closed the door on creating agile, customized, student-centered,
data-collection techniques that inform our context. Educators should feel
liberated to create tools their teams can use. A variety of resources are available.
We used School Reform
Initiative (SRI) as a starting point. Don’t let technical jargon stop you from
creating meaningful feedback mechanisms. Make your protocols simple, use
multiple choice rubrics or scales, and prioritize uncovering the student
learning journey. Then write new and exciting chapters; language and scales can
be tweaked later.
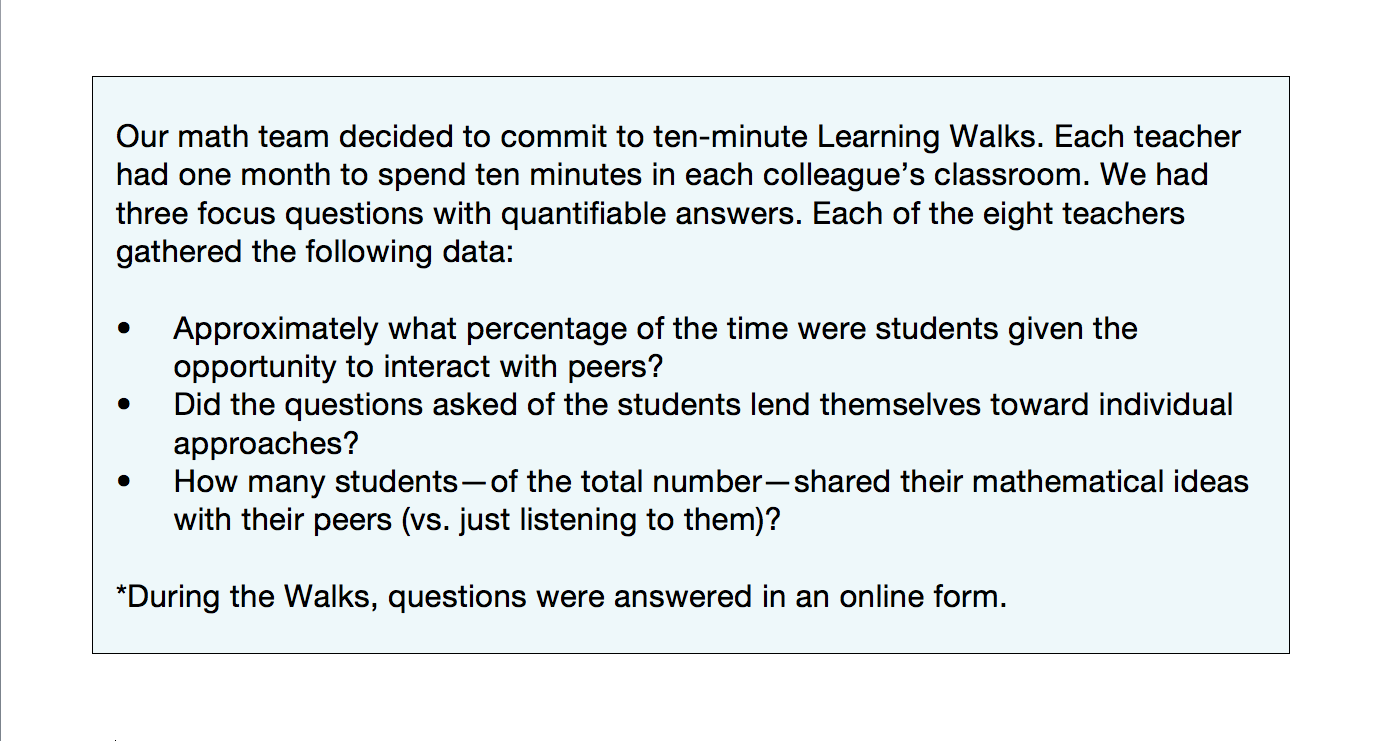
** A step-2 side note: School personnel who have used data
for accountability rather than data for empowerment might be trepidatious to
embark on Learning Walks. Here are a couple tips to shift the focus to
learning:
• Develop focus questions that
keep the lens on students, not teachers.
• Exploit the fact that humans
regress toward the mean: A teacher doesn’t need to fear that he or she has less
collaboration time when a teammate comes in. In fact, as we collect department
data, the results will come out to a statistical average that reflects the
program as a whole, not a focus on the teacher.
• Regression toward the mean can
also protect your question reliability: For each response to a question higher
than the norm, there would likely be a response to the same question lower than
the norm. Again, the focus is to dig into the work.
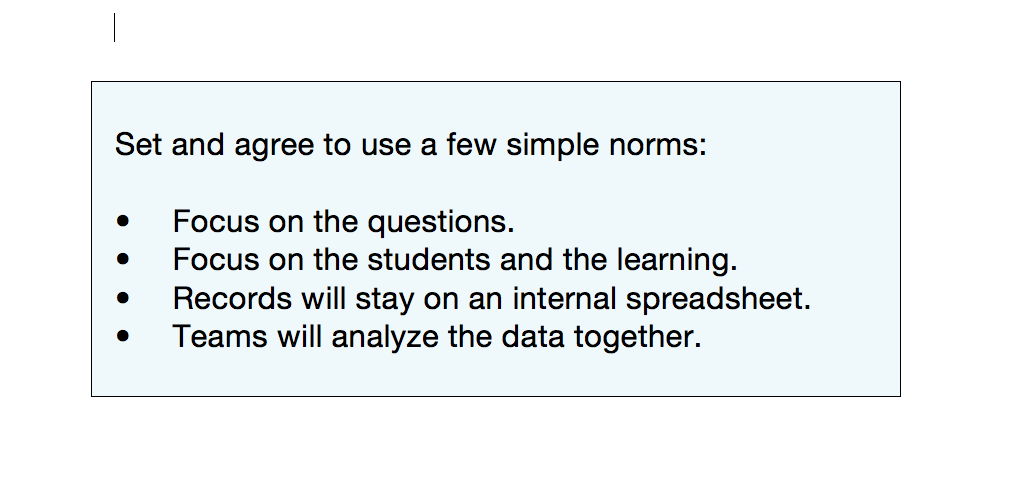
Step 3: Set team norms.
Educators must feel safe with data, how the data is
collected and analyzed, and the ways the data might be shared. Data norms are a
must before teams begin.
Step 4: Collect the data in timely ways, and follow up.
Teams should have a plan for
completion and check-ins along the way. Short time frames allow for multiple
rounds of data collection. Consider limiting the data project to less than a
quarter of the year. Educators’ jobs become overwhelming at times, so it is
essential to build in guidelines and incentives for support.

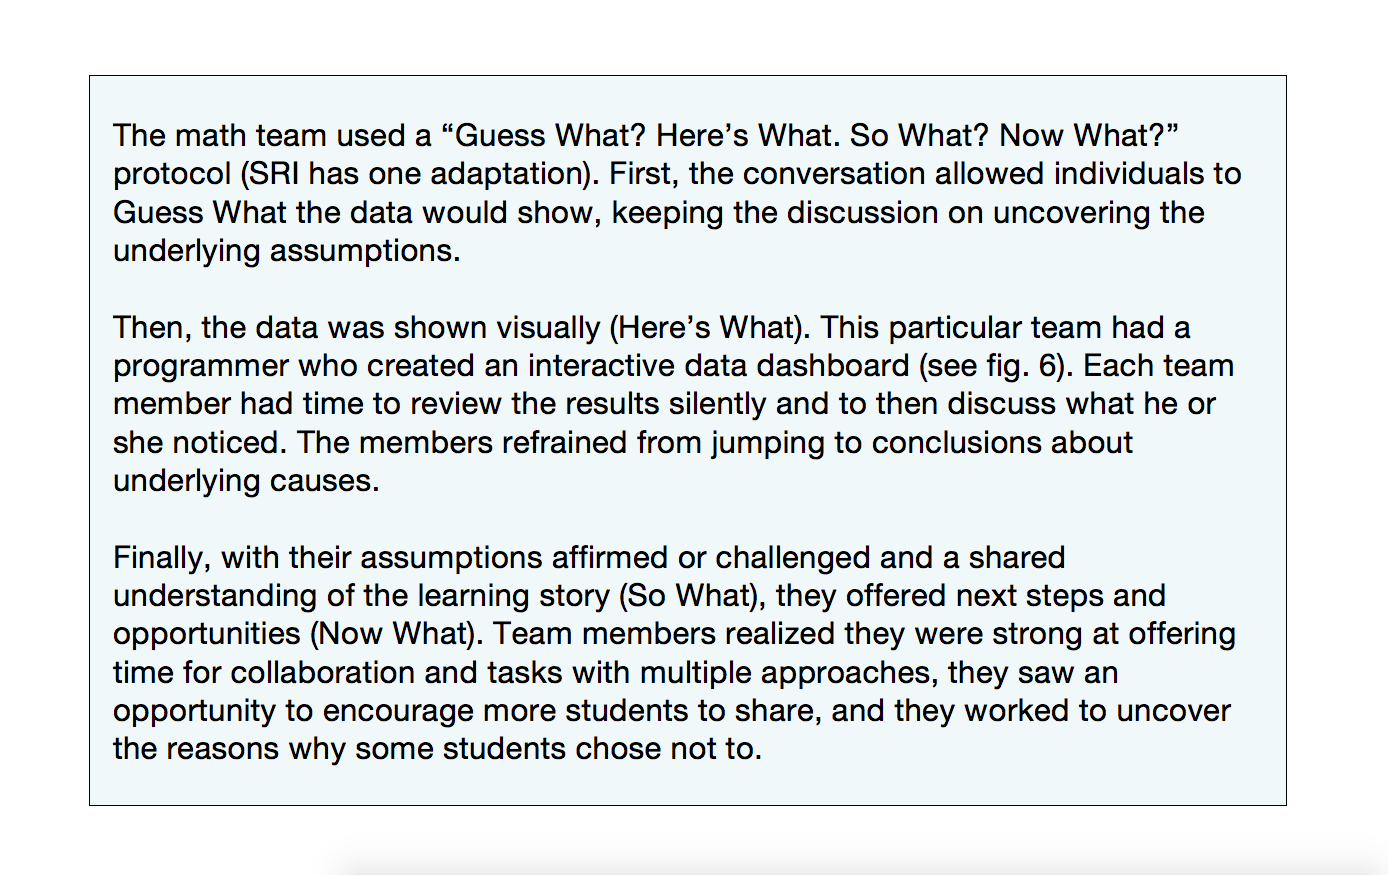
Step 5: Analyze the data using a protocol and data displays.
Our brains recognize visual patterns
from data better than they do scanning a spreadsheet. Use functions in
spreadsheet applications (.e.g., Google sheets) to make charts and data visualizations,
or use an online plot editor (e.g., Tableau, Plotly). Let your data come to
life! Adopt a protocol that focuses the conversation on results and focus
questions, rather than straying toward one particular experience. Several
resources and tools are available on my website, www.visualizeyourlearning.com.
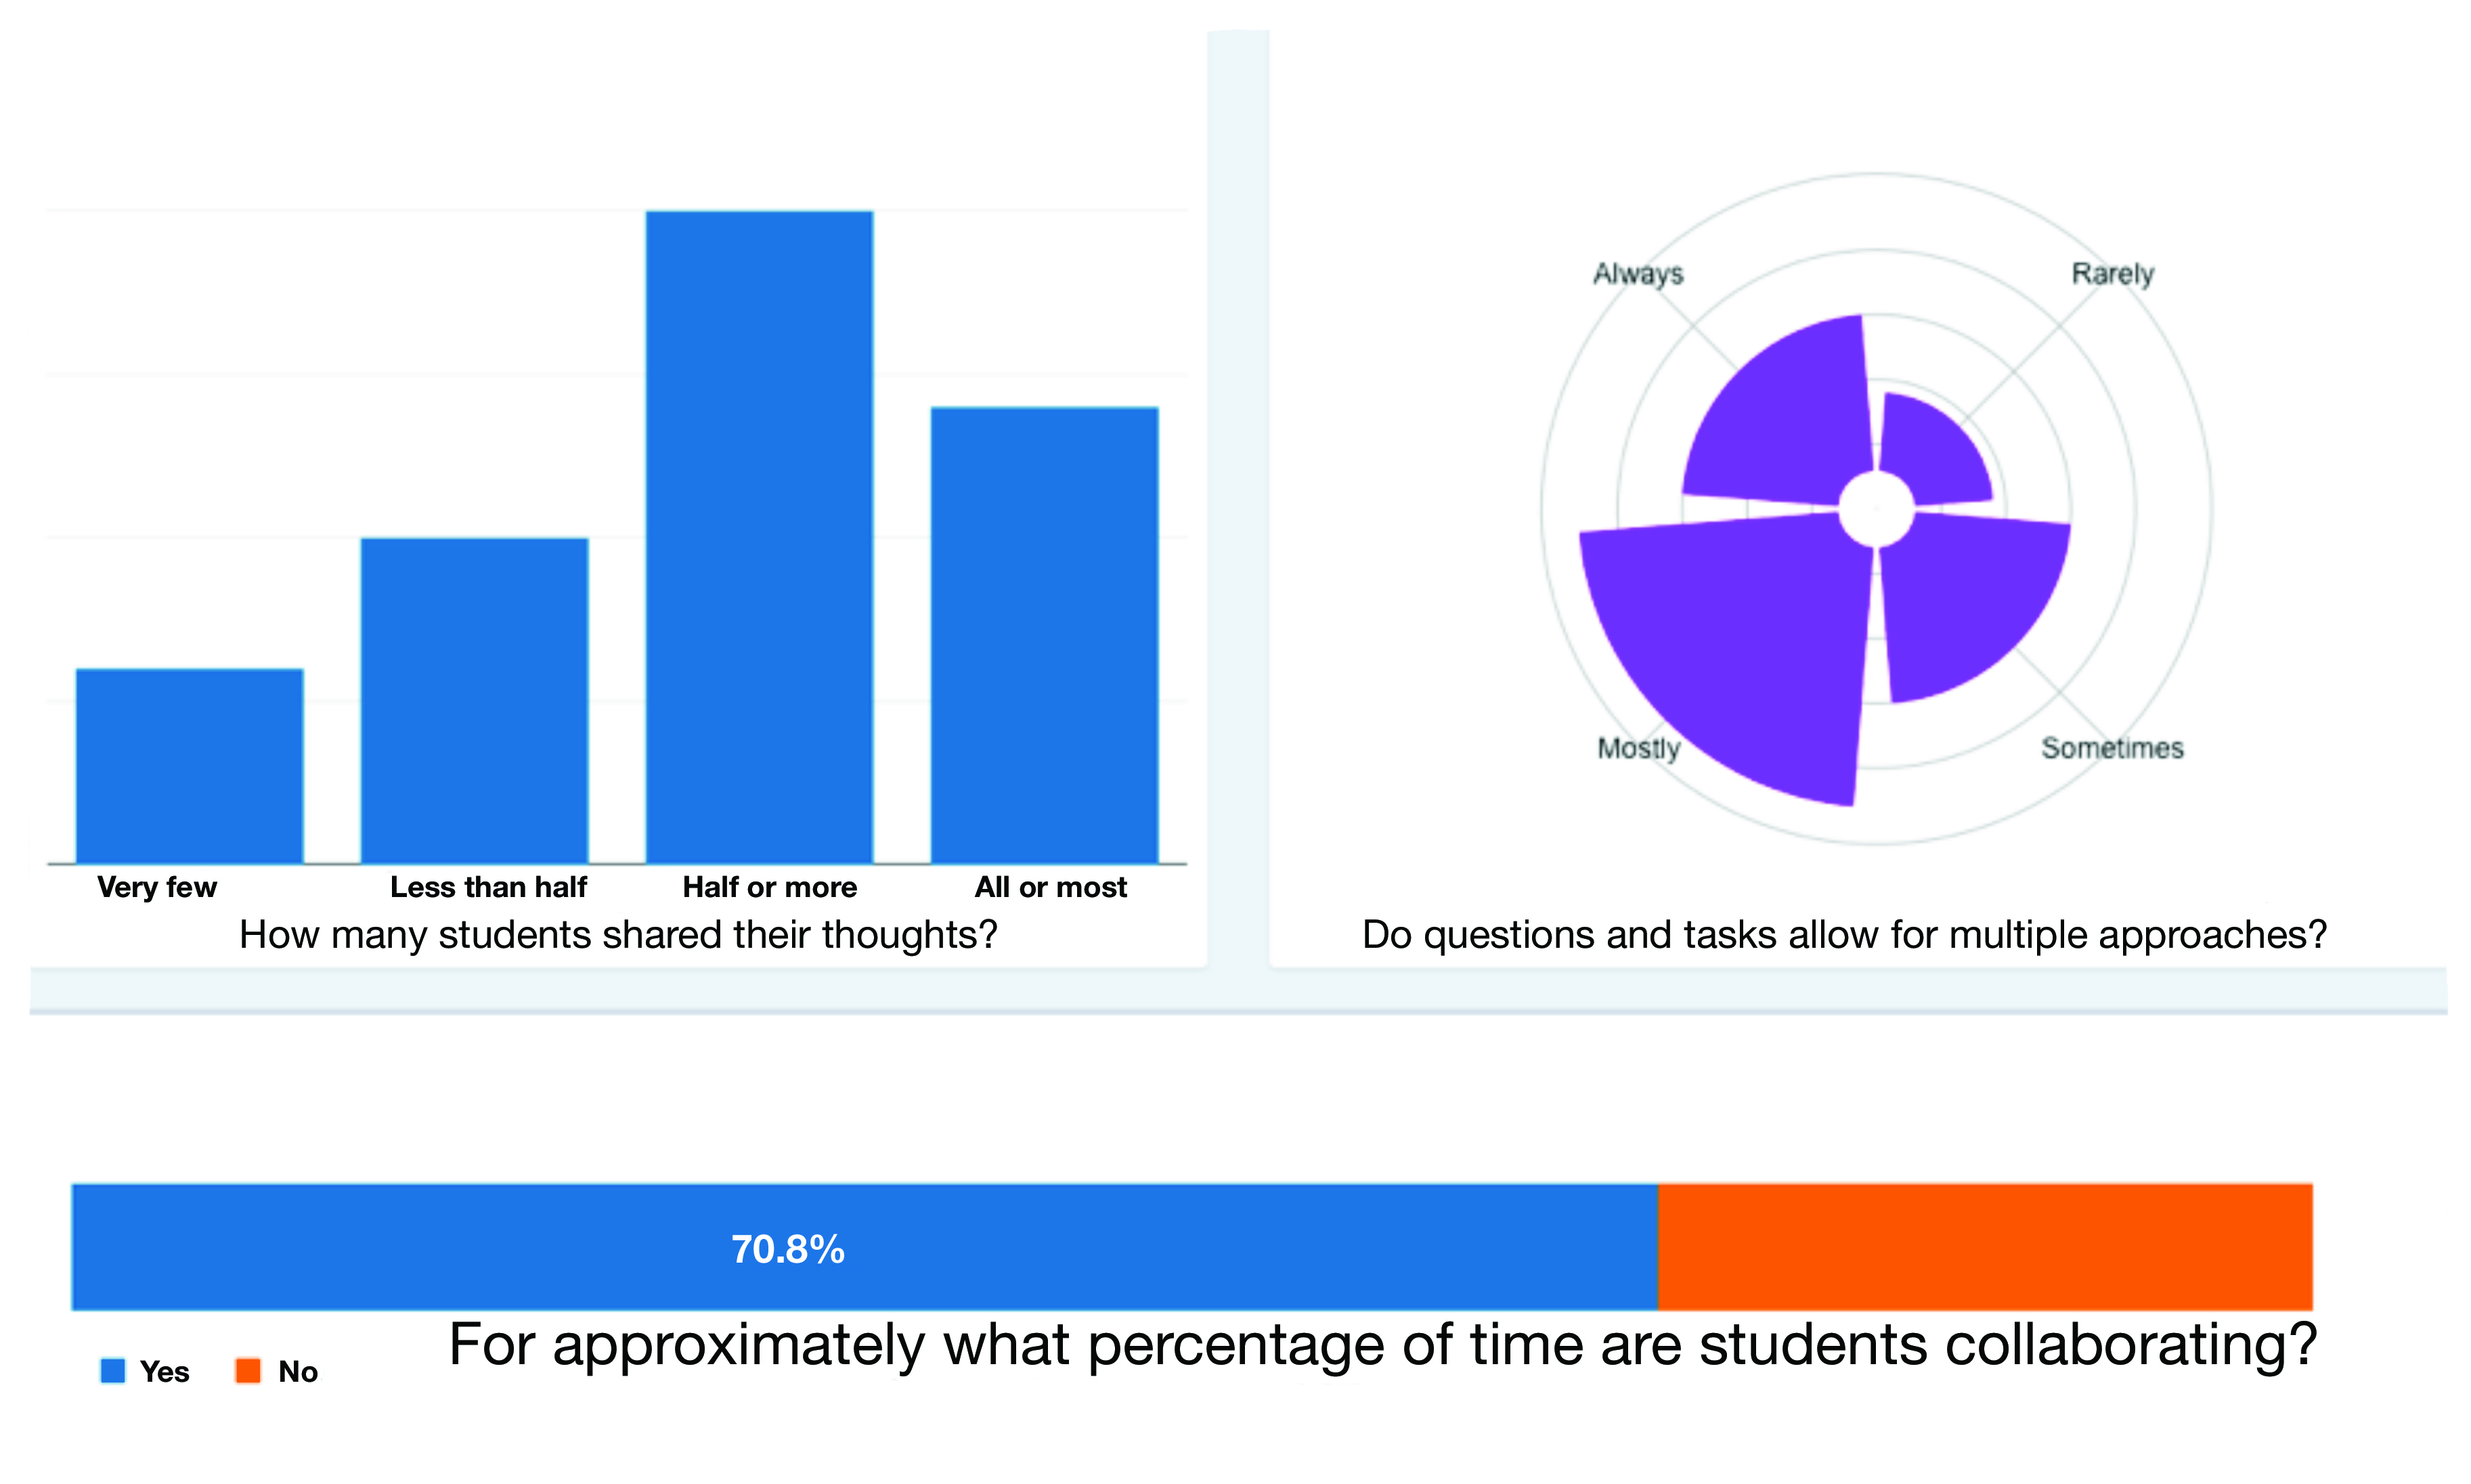
Sample made for Shanghai American School by Jordan Benedict
of visualizeyourlearning.com
Step 6: Repeat.
This process should not be a one-off;
in research terms, we want the study to be reproducible.
The live data dashboard encourages teachers to shift, rather than moving on. If
the example team truly values students’ individual ideas, they should be
revisiting how their students progress throughout the year and watching for how
the data changes as their teaching practices shift.

Step 7: Share the data with students.
Students will glean new and different
insights from the data, and they will actively work toward the set goals when
they can see the results. Educators have a tendency to work on data and make
decisions without students, yet it is imperative that students contribute
toward their own learning goals.
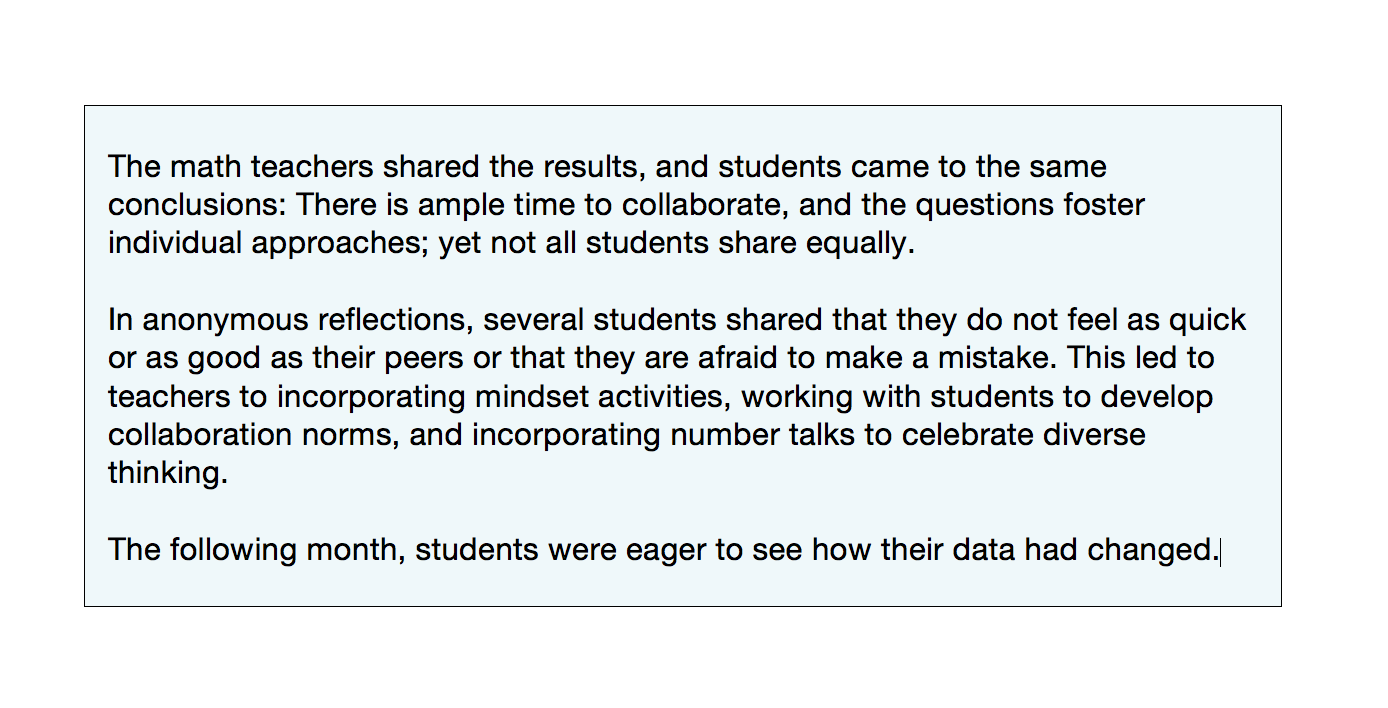
The story we have told is simple: Teachers
were inspired to start a journey of discovery, they created an inclusive plan,
they ensured the safety of their team and celebrated progress, they made a
reproducible tool that tracks long term acquisition of values, and they used
the most important contributor to learning: the students.
It’s
your turn
Find your shared values, ask those
burning questions, collect your student-centered data stories, and empower
change. Use the comment section below to share your own unique data story, or
join me on Twitter @JordanGBenedict with the hashtag #EdDataStories.
 Jordan Benedict
is a statistician, math teacher, triathlete, data coach, and life enthusiast.
He has spent the majority of his teaching career overseas in the Middle and Far
East, working with students from fourth grade to AP calculus. In his current
role at Shanghai American School, Benedict facilitates data workshops and
builds custom visualizations of learning data for action research projects,
department protocols, and whole school exploration. He is the curator and
creator of Visualize Your Learning,
a repository of data explorations with access to communication, advice, or
independent consulting.