By Jordan
Benedict, posted August 28, 2017
—
Educators often emit disparaging groans when another expert begin
to tout the importance of using learning data. Many of us have heard that we need
to use data, but we are un clear about how
to perform an analysis. We are often told we need to develop systems of practice
on collecting and using data, but we aren’t given the necessary time. As educators,
we are told to “get on board,” yet we have reservations around how data has been
used in the past.
In numerous districts, data is used as an accountability measure.
Often, standardized test scores are seen as a great decider, emerging in the waning
hours of the school year as a way to pass judgement on those who have not pleased
the data gods. It’s no wonder teachers struggle to buy in.
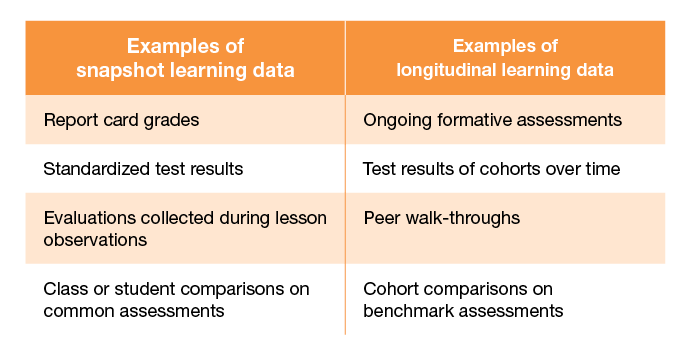
Data, when used in this penultimate way, misses the story of
our students’ learning. Learning has twists and turns, ups and downs, ebbs and flows.
Used appropriately, learning data should do the same: reflect the journey our students
take each year and the adventures that cohorts of students take over their K–grade
12 education. Data used in isolated instances is but a snapshot of a moment, full
of variability and lacking in context. Imagine if we took a snapshot when Luke Skywalker
lost his hand, or when Superman was killed. These fleeting moments miss their previous
and successive triumphs, their growth from small-time hero to protector of numerous
worlds, and their progress in cultivating meaningful relationships that aid their
quest. A single snapshot misses the whole story.
Seriously, making that shift—from snapshot data as a barometer
for accountability to longitudinal data that follows the complex narrative of education—is
important for educators to do.

Storytelling with data requires an element of time and repetition.
Both for monitoring progress and for noticing the subtle changes and connections.
Storytelling with data honors an administrator’s need for accountability, simultaneously
acknowledging that a single snapshot lacks in sample size. Storytelling with data
is used in an ongoing practice within professional teams who get genuinely excited
about the climax and conclusion of their learning story. Data should be dynamic,
not static, and the analysis done by teachers and students together, ensuring that
students’ learning stories remain autobiographical.
If we want to accurately tell our story, data protocols should
begin within schools. Formative assessments can be developed by teaching teams,
benchmark assessments can be created by departments, and walkthrough rubrics can
be driven by divisions. It only makes sense that the impetus and expertise comes
from those who are closest to the tale and understand the nuances and minutiae of
their unique classroom of characters.
We are not far off from these aspirations. We have recording
devices for walkthroughs and digital rubrics for assessments. We have model nations,
like Finland, who are paving the way for more flexibility and autonomy. My call
to action is this: If we want to impact change, we need to analyze data in inspiring,
ongoing, empowering, and authentic ways, following our hero’s journey through the
trials and tribulations of each academic year.
Your turn
Use the comments section below to share how you use data to narrate
the unique learning journey of your students, your classroom, and your school. Let’s
get the conversation started! Join me on Twitter at @JordanGBenedict and use the
hashtag #EdDataStories. In Part 2, we will examine explicit strategies for authoring
your own data story.

Jordan Benedict is a math teacher, triathlete, data
coach, and life enthusiast. He has spent the majority of his teaching career working
overseas in the Middle East and Far East, working with students from fourth grade
to AP calculus. In his current role at Shanghai American School, Benedict facilitates
data workshops and builds custom visualizations of learning data for action research
projects, department protocols, and whole-school exploration. He is the curator
and creator of Visualize Your Learning, a repository of data explorations
with access to communication, advice, or independent consulting.